Exam 10: Data Description and Probability Distributions
Exam 1: Linear Equations and Graphs59 Questions
Exam 2: Functions and Graphs178 Questions
Exam 3: Mathematics of Finance57 Questions
Exam 4: Systems of Linear Equations; Matrices115 Questions
Exam 5: Linear Inequalities and Linear Programming26 Questions
Exam 6: Linear Programming: The Simplex Method58 Questions
Exam 7: Logic, Sets, and Counting51 Questions
Exam 8: Probability59 Questions
Exam 9: Markov Chains60 Questions
Exam 10: Data Description and Probability Distributions65 Questions
Exam 11: Games and Decisions52 Questions
Exam 12: Appendix A: Basic Algebra Review45 Questions
Exam 13: Appendix B: Special Topics20 Questions
Select questions type
According to a college survey, 22% of all students work full time. Find the mean for the random variable X, the number of students who work full time in samples of size 16.Find the mean of the binomial distribution.
(Multiple Choice)
4.8/5  (30)
(30)
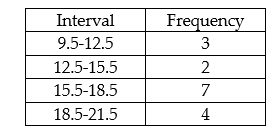
Construct a frequency table:
-The following are the heights, in inches, of ten middle school basketball players. Determine the data range for the following data set. Also, construct a frequency table for the data set, use a class interval width of 2 and start with 62.5 inches. 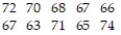
(Short Answer)
4.9/5 (38)
Find the standard deviation for the following grouped data:
(Multiple Choice)
4.8/5 (36)
What proportion of the following sample of ten measurements lies within 2 standard deviations of the mean?

(Multiple Choice)
4.8/5 (38)
A small company employs a supervisor at $1200 a week, an inventory manager at $800 a week, 5 stock boys at $400 a week each, and 3 drivers at $700 a week each.
(Multiple Choice)
4.9/5 (33)
Assume the distribution is normal. Use the area of the normal curve to answer the question. Round to the nearest whole percent:
-A machine produces screws with an average diameter of 0.30 inches and a standard deviation of 0.01 inches. What is the probability that a screw will have a diameter greater than 0.32 inches?
(Multiple Choice)
4.9/5 (25)
A fair coin is tossed fourteen times. What is the probability of obtaining the following? Express the answer both in terms  of and as a four-place decimal.
-Exactly 12 heads?
of and as a four-place decimal.
-Exactly 12 heads?
(Short Answer)
4.8/5 (39)
According to a college survey, 22% of all students do not work. Find the standard deviation for the random variable X, the number of students who do not work in samples of size 16.
(Multiple Choice)
4.9/5 (34)
Find the median for the data set:
2, 14, 35, 2, 8, 35, 14, 8, 6, 2, 2, 2, 2, 8, 2
(Multiple Choice)
4.8/5 (38)
Construct the specified histogram:
-Twenty voters were asked their age. The results are summarized in the frequency table below. 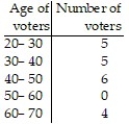
 Construct a histogram.
(Short Answer)
4.8/5 (39)
The register of a college recorded the amount of time each student spent waiting in line during peak registration hours one Monday. The frequency table below summarizes the results. Find the standard deviation. Round your answer to one decimal place. 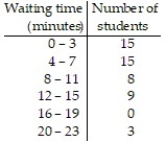
(Multiple Choice)
4.8/5 (22)
In the English department of a midwestern university, the annual salaries of five faculty members are $34,000, $35,000, $36,000, $36,500 and $65,000.
Compute the mean.
(Multiple Choice)
4.7/5 (40)
Construct a bar graph of the given frequency distribution:
-The frequency distribution indicates the height in feet of persons in a group of 216 people. 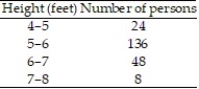
(Multiple Choice)
4.9/5 (30)
Construct the specified histogram:
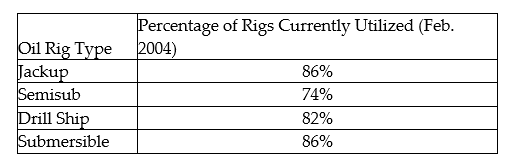
-Construct a histogram for the following set of data on oil rig utilization by type.
(Short Answer)
4.8/5 (35)
Construct a histogram for the binomial distribution  ,and compute the mean and standard deviation:
-n = 6, p =
,and compute the mean and standard deviation:
-n = 6, p = 
(Short Answer)
4.8/5 (37)
Here are the prices for 8 different MP3 players. Find the range.
$195 $358 $201 $276 $161 $301 $387 $128
(Multiple Choice)
4.8/5 (36)
A normal random variable X has mean 40 and standard deviation 16. Find the area under the normal curve above the interval 16-60.
(Multiple Choice)
4.9/5 (49)
Filters
- Essay(0)
- Multiple Choice(0)
- Short Answer(0)
- True False(0)
- Matching(0)