Exam 8: Anova to Compare Means
Exam 1: Collecting Data68 Questions
Exam 2: Describing Data127 Questions
Exam 3: Confidence Intervals149 Questions
Exam 4: Hypothesis Tests117 Questions
Exam 5: Approximating With a Distribution74 Questions
Exam 6: Inference for Means and Proportions166 Questions
Exam 7: CHI-Square Tests for Categorical Variables45 Questions
Exam 8: Anova to Compare Means53 Questions
Exam 9: Inference for Regression123 Questions
Exam 10: Multiple Regression72 Questions
Select questions type
Use the following to answer the questions below:
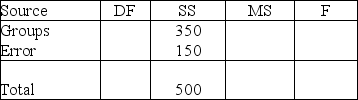
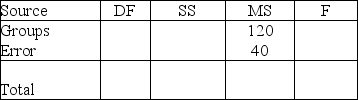
The sample sizes for the groups in a dataset and an outline of an analysis of variance table with partial information are provided. Fill in the missing parts of the table. Round decimal answers to two decimal places.
-Three groups with  = 10,
= 10,  = 10, and
  = 10.
= 10.
(Essay)
4.8/5  (50)
(50)
Use the following to answer the questions below:
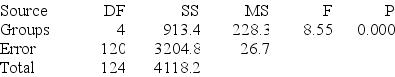
A small university is concerned with monitoring its electricity usage in its Student Center. Specifically, its officials want to know if the amount of electricity used differs by day of the week. They collected data for nearly a year, and the relevant summary statistics are provided. Note that electricity usage is measured in kilowatt hours.
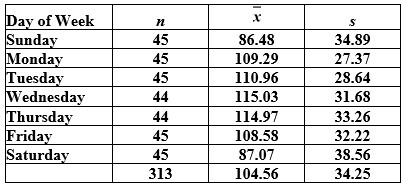 -Use the data and ANOVA results to construct a 95% confidence interval for the difference in mean electricity use between Saturdays and Sundays. Round the margin of error to two decimal places. Does your interval suggest a significant difference in mean electricity use for these two days?
(Multiple Choice)
4.8/5 (42)
Use the following to answer the questions below:
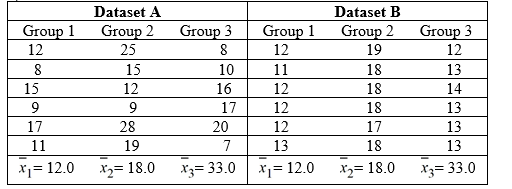
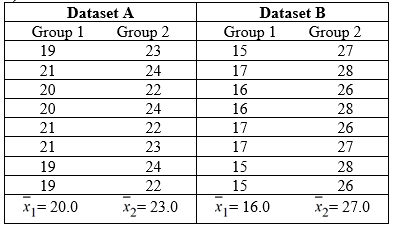
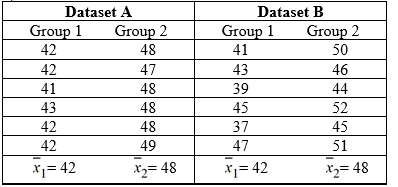
Two sets of sample data, A and B, are given. Without doing any calculations, indicate in which set of sample data, A or B, there is likely to be stronger evidence of a difference in the population means.
-
(Multiple Choice)
4.9/5 (34)
Use the following to answer the questions below:
An environmental studies student working on an independent research project was investigating metal contamination in the St. Lawrence River. The metals can accumulate in organisms that live in the river (known as bioaccumulation). He collected samples of Quagga mussels at three sites in the St. Lawrence River and measured the concentration of copper (in micrograms per gram, μg/g or mcg/g) in the mussels. His data are summarized in the provided table and plot. He wants to know if there are any significant differences in mean copper concentration among the three sites.
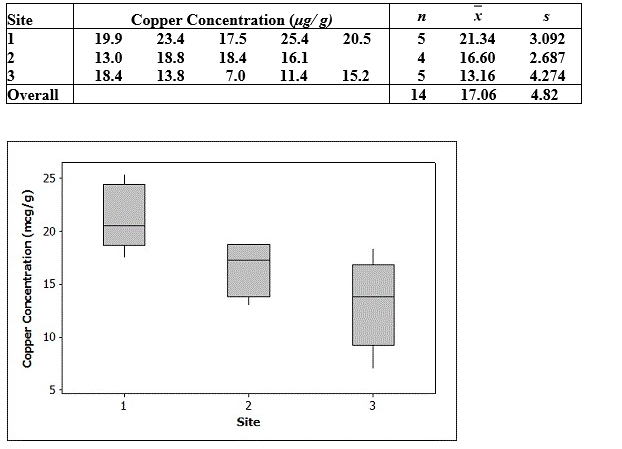 -Computer output from the analysis gives a p-value of 0.011. Test, using α = 0.05, for a difference in mean copper concentration among the three sites. Include all details of the test.
(Essay)
4.7/5 (28)
Use the following to answer the questions below:
Two sets of sample data, A and B, are given. Without doing any calculations, indicate in which set of sample data, A or B, there is likely to be stronger evidence of a difference in the population means.
-Some computer output from an analysis of variance is provided.
 What is the overall sample size?
(Multiple Choice)
4.8/5 (32)
Use the following to answer the questions below:
A small university is concerned with monitoring its electricity usage in its Student Center. Specifically, its officials want to know if the amount of electricity used differs by day of the week. They collected data for nearly a year, and the relevant summary statistics are provided. Note that electricity usage is measured in kilowatt hours.
-Computer output provides the following grouping information:
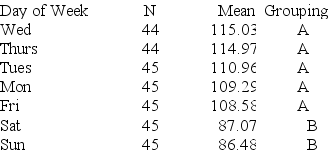 Means that do not share a letter are significantly different.
Use the output to make a statement about how electricity usage differs significantly by day of the week.
Means that do not share a letter are significantly different.
Use the output to make a statement about how electricity usage differs significantly by day of the week.
(Multiple Choice)
4.9/5 (39)
Use the following to answer the questions below:
The sample sizes for the groups in a dataset and an outline of an analysis of variance table with partial information are provided. Fill in the missing parts of the table. Round decimal answers to two decimal places.
-Three groups with  = 8,
= 8,  = 7, and
  = 5.
= 5.
(Essay)
4.8/5 (27)
Use the following to answer the questions below:
An environmental studies student working on an independent research project was investigating metal contamination in the St. Lawrence River. The metals can accumulate in organisms that live in the river (known as bioaccumulation). He collected samples of Quagga mussels at three sites in the St. Lawrence River and measured the concentration of copper (in micrograms per gram, μg/g or mcg/g) in the mussels. His data are summarized in the provided table and plot. He wants to know if there are any significant differences in mean copper concentration among the three sites.
-Construct the ANOVA table and test, using α = 0.05, for a difference in mean copper concentration among the three sites. Round decimal values to two decimal places. Include all details of the test.
(Essay)
4.8/5 (37)
Use the following to answer the questions below:
An environmental studies student working on an independent research project was investigating metal contamination in the St. Lawrence River. The metals can accumulate in organisms that live in the river (known as bioaccumulation). He collected samples of Quagga mussels at three sites in the St. Lawrence River and measured the concentration of copper (in micrograms per gram, μg/g or mcg/g) in the mussels. His data are summarized in the provided table and plot. He wants to know if there are any significant differences in mean copper concentration among the three sites.
-Use the summary information and results from the ANOVA to construct 95% confidence intervals for the differences in each pair of means:
(a) Site 1 and Site 2
(b) Site 1 and Site 3
(c) Site 2 and Site 3
In each case, round the margin of error to two decimal places. Based on your work, which sites have significantly different means? Briefly justify your answer.
(Essay)
4.8/5 (32)
Use the following to answer the questions below:
A small university is concerned with monitoring its electricity usage in its Student Center. Specifically, its officials want to know if the amount of electricity used differs by day of the week. They collected data for nearly a year, and the relevant summary statistics are provided. Note that electricity usage is measured in kilowatt hours.
-Based on the ANOVA results, test at the 5% level whether the data provide evidence of a difference in mean electricity use on Sundays and Mondays. Use three decimal places in the test statistic.
(Essay)
4.9/5 (36)
Use the following to answer the questions below:
Breakfast is often considered to be the most important meal of the day. Data on the number of calories per serving for randomly selected cereals from three different brands (General Mills, Kellogg's, and Kashi) are summarized in the provided plot and table.
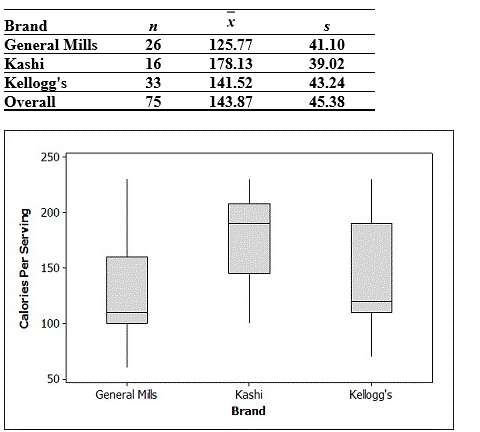 -Use the summary information and the fact that the sums of squares for groups is SSG = 27,476 and for error is SSTotal = 152,379 to test for significant differences (using
 ) in each pair of means:
(a) General Mills and Kashi
(b) General Mills and Kellogg's
(c) Kashi and Kellogg's
In each case, round the test statistic to three decimal places. Based on your work, which brands have significantly different means? Briefly justify your answer.
) in each pair of means:
(a) General Mills and Kashi
(b) General Mills and Kellogg's
(c) Kashi and Kellogg's
In each case, round the test statistic to three decimal places. Based on your work, which brands have significantly different means? Briefly justify your answer.
(Essay)
4.8/5 (33)
Use the following to answer the questions below:
Two sets of sample data, A and B, are given. Without doing any calculations, indicate in which set of sample data, A or B, there is likely to be stronger evidence of a difference in the population means.
-SSE = SSTotal + SSG
(True/False)
4.8/5 (33)
Use the following to answer the questions below:
Breakfast is often considered to be the most important meal of the day. Data on the number of calories per serving for randomly selected cereals from three different brands (General Mills, Kellogg's, and Kashi) are summarized in the provided plot and table.
-Computer output provides the following grouping information:
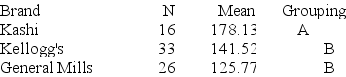 Means that do not share a letter are significantly different.
Based on this output, which brands have significantly different means? Briefly justify your answer.
Means that do not share a letter are significantly different.
Based on this output, which brands have significantly different means? Briefly justify your answer.
(Essay)
4.9/5 (32)
Use the following to answer the questions below:
Summary statistics from a dataset and the corresponding computer analysis of variance output are provided.
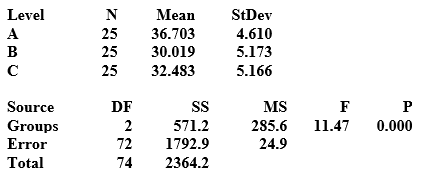 -What degrees of freedom are used in doing inferences for these means and differences in means after ANOVA?
(Multiple Choice)
4.8/5 (46)
Use the following to answer the questions below:
Breakfast is often considered to be the most important meal of the day. Data on the number of calories per serving for randomly selected cereals from three different brands (General Mills, Kellogg's, and Kashi) are summarized in the provided plot and table.
-State the appropriate null and alternative hypotheses for testing if the mean calories per serving differs among the three brands.
(Multiple Choice)
5.0/5 (37)
Use the following to answer the questions below:
Two sets of sample data, A and B, are given. Without doing any calculations, indicate in which set of sample data, A or B, there is likely to be stronger evidence of a difference in the population means.
-
(Multiple Choice)
4.9/5 (38)
Use the following to answer the questions below:
Two sets of sample data, A and B, are given. Without doing any calculations, indicate in which set of sample data, A or B, there is likely to be stronger evidence of a difference in the population means.
-A scientist performing analysis of variance has the following null hypothesis:
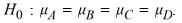 What is the appropriate alternative hypothesis for his analysis?
(Multiple Choice)
4.9/5 (44)
Use the following to answer the questions below:
A small university is concerned with monitoring its electricity usage in its Student Center. Specifically, its officials want to know if the amount of electricity used differs by day of the week. They collected data for nearly a year, and the relevant summary statistics are provided. Note that electricity usage is measured in kilowatt hours.
-Using the results from the ANOVA analysis, at an = 0.05 level of confidence, what is the conclusion of the test, in context?
(Multiple Choice)
4.7/5 (40)
Use the following to answer the questions below:
Summary statistics from a dataset and the corresponding computer analysis of variance output are provided.
-Find a 95% confidence interval for the difference in the means of Populations A and B. Round the margin of error to three decimal places.
(Multiple Choice)
4.9/5 (30)
Use the following to answer the questions below:
Two sets of sample data, A and B, are given. Without doing any calculations, indicate in which set of sample data, A or B, there is likely to be stronger evidence of a difference in the population means.
-
(Multiple Choice)
4.9/5 (28)
Filters
- Essay(0)
- Multiple Choice(0)
- Short Answer(0)
- True False(0)
- Matching(0)