Exam 11: Estimating Means With Confidence
Exam 1: Statistics Success Stories and Cautionary Tales79 Questions
Exam 2: Turning Data Into Information94 Questions
Exam 3: Relationships Between Quantitative Variables99 Questions
Exam 4: Relationships Between Categorical Variables100 Questions
Exam 5: Sampling: Surveys and How to Ask Questions109 Questions
Exam 6: Gathering Useful Data for Examining Relationships90 Questions
Exam 7: Probability112 Questions
Exam 8: Random Variables115 Questions
Exam 9: Understanding Sampling Distributions: Statistics As Random Variables231 Questions
Exam 10: Estimating Proportions With Confidence104 Questions
Exam 11: Estimating Means With Confidence103 Questions
Exam 12: Testing Hypotheses About Proportions139 Questions
Exam 13: Testing Hypotheses About Means166 Questions
Exam 14: Inference About Simple Regression115 Questions
Exam 15: More About Inference for Categorical Variables111 Questions
Exam 16: Analysis of Variance111 Questions
Exam 17: Turning Information Into Wisdom70 Questions
Select questions type
Use the following information for questions:
For a randomly selected sample of 20 new mothers in the year 2000, the mean age was 24.6 years. For a randomly selected sample of 10 new mothers in 1970, the mean age was 21.4 years. The difference between the mean ages is 3.2 years, and the standard error of the difference is 1.366. Assume that the ages of new mothers are normally distributed, do not assume the population variances are equal, and use the conservative "by hand" estimate for the degrees of freedom.
-Calculate a 90% confidence interval for the difference in population mean ages of new mothers in the two years (year 2000 - year 1970).
(Multiple Choice)
4.7/5  (34)
(34)
Use the following information for questions:
Spatial perception is measured on a scale from 0 to 10. A group of 9th grade students are tested for spatial perception. SPSS was used to calculate descriptive statistics of the spatial perception scores in the sample. 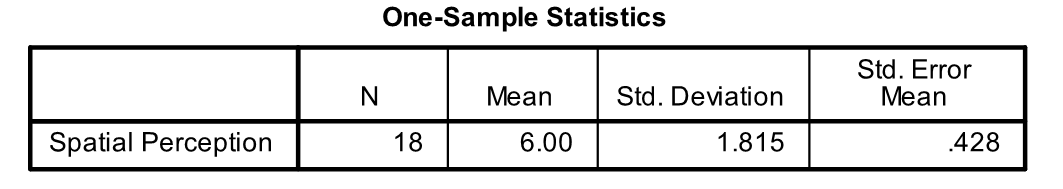 -Give a 90% confidence interval for the average spatial perception score for all 9th graders.
(Short Answer)
4.8/5 (33)
A research study compares the risk of lung disease for men who smoke to the risk of lung disease for women who smoke. The sample relative risk is 1.1 and a 95% confidence interval for the relative risk is 0.5 to 1.9. Which of the following statements is most correct about the comparison of the two groups?
(Multiple Choice)
4.7/5 (40)
Use the following information for questions:
A Statistics instructor asked a random sample of female and male students how many hours they exercise each week. Minitab output for a comparison of females and males is shown below. 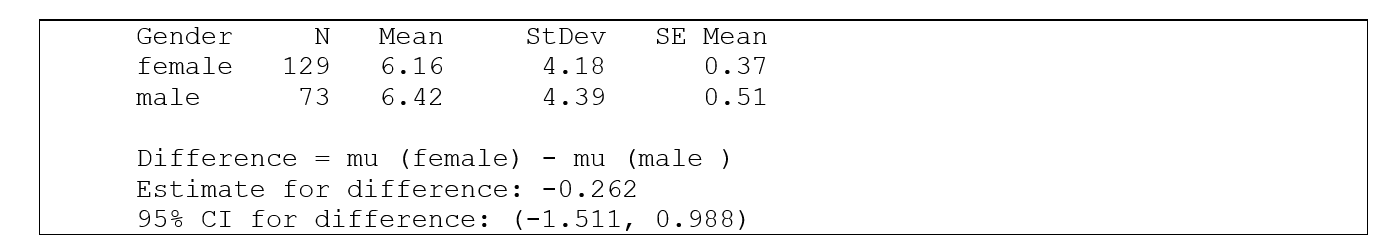 -Based on the output given, what can be concluded about the difference between the mean amounts that females and males exercise per week (female -male)?
(Multiple Choice)
4.9/5 (24)
The weights of a sample of n = 8 college men will be used to create a 95% confidence interval for the mean weight of all college men. What is the correct t* multiplier involved in calculating the interval?
(Multiple Choice)
4.9/5 (39)
Use the following information for questions:
An experiment is conducted with 15 seniors who are taking Spanish at Oak View High School. A randomly selected group of eight students is first tested with a written test and a day later with an oral exam. To avoid order effects, the other seven students are tested in reverse order. The instructor is interested in the difference in grades between the two testing methods. SPSS is used to obtain descriptive statistics for the grades of the two tests.  -What is the value of the standard error for the difference in mean grades between the two testing methods?
(Multiple Choice)
4.7/5 (36)
Use the following information for questions:
Managerial training programs often teach supervisory skills. Are these training programs effective? A company psychologist administers a test to each of 10 supervisors before and after attending such a training program. Higher scores indicate increased supervisory skills. The results are used to estimate the mean improvement in supervisory skills.
-Give a 95% confidence interval for the population mean improvement in supervisory skills for all supervisors who take the training program.
(Short Answer)
4.9/5 (40)
Use the following information for questions:
Spatial perception is measured on a scale from 0 to 10. Two groups of 8th grade children are tested for spatial perception. The students in group 1 were first given a short course on spatial concepts. The students in group 2 received no such instruction. SPSS was used to calculate descriptive statistics for the two samples. 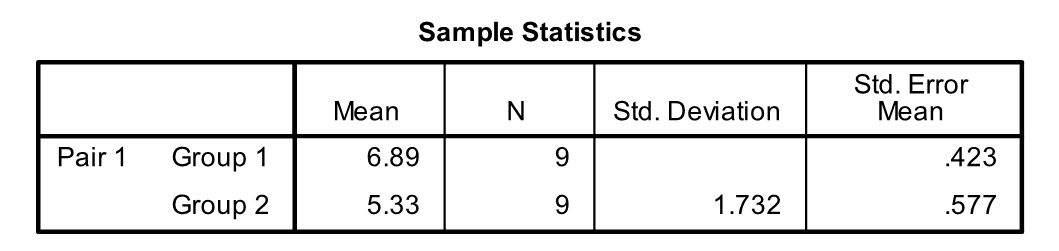 -What is the value of the standard deviation for measurements made on the group 1 students, which is missing in the output?
(Multiple Choice)
4.8/5 (39)
Reaction time is measured in a driving simulator for a random sample of 16 year-old boys and a random sample of 24 year-old young men. SPSS was used to obtain descriptive statistics 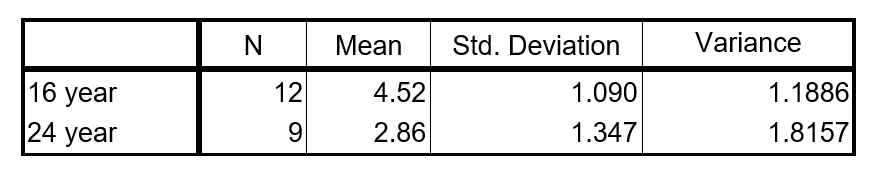 Calculate a 95% confidence interval for the difference in mean reaction time (16 year-olds - 24 year-olds). Assume that t reaction time is normally distributed, but do not assume the population variances are equal, and use the conservative "by-hand" estimate for the degrees of freedom.
(Short Answer)
4.9/5 (30)
Use the following information for questions:
A union representative has collected some data on the hourly pay of workers in the area. He is curious to find out if hourly pay actually increases with age. He does not have the actual ages of the workers in his sample, but he does have age group information. For now, he wishes to compare the young workers (18-30 years old) with the middle aged workers (31-45 years old) by calculating a confidence interval for the difference in population mean salaries.
-The two sample standard deviations are very similar so the pooled procedure will be used. If the researcher has collected data on 32 young workers and 40 middle aged workers, what would be the degrees of freedom for the t* multiplier?
(Short Answer)
4.9/5 (43)
A randomly selected sample of 60 mathematics majors spent an average of $200.00 for textbooks one term, while during the same term, a randomly selected sample of 40 literature majors spent an average of $180.00 for textbooks. The standard deviation for each sample was $20.00. The standard error for the difference between the two sample means is
(Multiple Choice)
4.8/5 (37)
The amount of time single men and women spend on house work is measured for 15 single women and 25 single men. For the women the mean was 7 hours/week with a standard deviation of 1.5. For the men the mean was 4.5 hours/week with a standard deviation of 1.1. What is the value of the pooled standard deviation for the difference in mean time spent on housework between single men and women?
(Multiple Choice)
4.7/5 (37)
The distinction between a sampling distribution and a confidence interval is:
(Multiple Choice)
4.8/5 (39)
Use the following information for questions:
Spatial perception is measured on a scale from 0 to 10. Two groups of 8th grade children are tested for spatial perception. The students in group 1 were first given a short course on spatial concepts. The students in group 2 received no such instruction. SPSS was used to calculate descriptive statistics for the two samples.
-Calculate a 95% confidence interval for the mean spatial perception score for students with instruction.
(Multiple Choice)
4.8/5 (36)
What is the primary purpose of a 95% confidence interval for a mean?
(Multiple Choice)
4.8/5 (28)
Use the following information for questions:
Spatial perception is measured on a scale from 0 to 10. A group of 9th grade students are tested for spatial perception. SPSS was used to calculate descriptive statistics of the spatial perception scores in the sample.
-Explain in your own words what the value 0.428 in the output measures.
(Short Answer)
4.9/5 (38)
A random sample of 30 airline flights during a storm had an average delay of 40 minutes. The standard deviation was 5 minutes. Calculate a 98% confidence interval for the average delay for all flights during a storm.
(Multiple Choice)
4.8/5 (31)
Use the following information for questions:
A Statistics instructor asked a random sample of female and male students how many hours they exercise each week. Minitab output for a comparison of females and males is shown below.
-This is an example of data collected using
(Multiple Choice)
4.8/5 (32)
Use the following information for questions:
As the number of men with lung cancer declines, the American Cancer Society estimates that 73,020 women will die in the United States of lung cancer this year, more than those who will die from breast, ovarian and uterine cancers combined. While no national studies have yet been done, many lung cancer specialists say they are seeing a disturbing trend of more and more non-smoking women with the disease. Based on one study, it is estimated that 10 to 15 percent of lung cancer victims are non-smokers. Suppose the range from 10 to 15 percent actually represents a 95% confidence interval.
-What was the margin of error associated with this estimate of the proportion of lung cancer victims that are non-smokers?
(Short Answer)
4.8/5 (38)
Filters
- Essay(0)
- Multiple Choice(0)
- Short Answer(0)
- True False(0)
- Matching(0)