Exam 9: Understanding Sampling Distributions: Statistics As Random Variables
Exam 1: Statistics Success Stories and Cautionary Tales79 Questions
Exam 2: Turning Data Into Information94 Questions
Exam 3: Relationships Between Quantitative Variables99 Questions
Exam 4: Relationships Between Categorical Variables100 Questions
Exam 5: Sampling: Surveys and How to Ask Questions109 Questions
Exam 6: Gathering Useful Data for Examining Relationships90 Questions
Exam 7: Probability112 Questions
Exam 8: Random Variables115 Questions
Exam 9: Understanding Sampling Distributions: Statistics As Random Variables231 Questions
Exam 10: Estimating Proportions With Confidence104 Questions
Exam 11: Estimating Means With Confidence103 Questions
Exam 12: Testing Hypotheses About Proportions139 Questions
Exam 13: Testing Hypotheses About Means166 Questions
Exam 14: Inference About Simple Regression115 Questions
Exam 15: More About Inference for Categorical Variables111 Questions
Exam 16: Analysis of Variance111 Questions
Exam 17: Turning Information Into Wisdom70 Questions
Select questions type
Use the following information for questions:
Items produced by a certain process are supposed to weigh 90 grams. However, the process is such that there is variability in the items produced and they do not all weigh exactly 90 grams. The distribution of weights is normal with a mean of 89.8 grams and a standard deviation of 1.1 gram.
-Suppose we sample one of these items. What is the probability that it weighs more than 91 grams?
(Short Answer)
4.9/5  (32)
(32)
Imagine taking many different samples of n = 30 values from a population of resting pulse rate values. Which one of these statistics is most likely to have a sampling distribution that is approximately a normal distribution?
(Multiple Choice)
4.9/5 (37)
Use the following information for questions:
In a random sample of 50 men, 40% said they preferred to walk up stairs rather than take the elevator. In a random sample of 40 women, 50% said they preferred the stairs. The difference between the two sample proportions (men - women) is to be calculated.
-Which of the following choices correctly denotes the difference between the two sample proportions that is to be calculated?
(Multiple Choice)
4.9/5 (27)
Use the following information for questions:
In each situation, indicate whether it would make more sense to find a confidence interval for the population parameter or to conduct a hypothesis test for a specific null value. If your answer is "a hypothesis test," specify the null value that you would test.
-The University of Wisconsin is conducting a study to determine if the average salary of college lecturers in the natural sciences is higher than that of lecturers in the social sciences.
(Short Answer)
4.9/5 (37)
Test scores for a standardized math test follow a normal distribution with a mean of 73 and a standard deviation of 8. A random sample of 23 students took this math test. What is the probability that the average score of the 23 students falls above 75?
(Multiple Choice)
4.9/5 (24)
Use the following information for questions:
The distribution of quiz, exam, and course grades is known to be left-skewed. The course grades (measured as percentage scores) in upper level statistics classes have a mean of 68 with a standard deviation of 15.
-Suppose 50 course grades are to be randomly selected and the average score in the sample calculated. What is the standard deviation of the sampling distribution of the average percentage score in the sample of 50 course grades?
(Short Answer)
4.7/5 (43)
A researcher wishes to determine if female students and male students differ in the size of their network of friends. She selects random samples of 10 female and 15 male students. Descriptive statistics are given below:
= 10 = 23 = 7.8
= 15 = 16 = 6.4
What is the standard error for the sampling distribution of - ?
(Multiple Choice)
4.8/5 (40)
When a random sample is to be taken from a population and a statistic is to be computed, the statistic can also be thought of as
(Multiple Choice)
4.7/5 (38)
Use the following information for questions:
A large company is making all of its employees take a stress test. Test scores on this stress test follow a normal distribution with a mean score of 3 and a standard deviation of 0.9. A random sample of 35 employees is to be taken.
-What is the standard deviation of the sampling distribution of the sample mean stress score?
(Short Answer)
4.7/5 (29)
Use the following information for questions:
A comparison is to be made between the proportion of second graders that cannot read at second grade level and the proportion of third graders that cannot read at second grade level. School records from schools across the state are collected and records for 123 second graders and 146 third graders are randomly selected. Of the sampled second graders, 25 seem to be not reading at second grade level. Of the sample third graders, 26 do not read at second grade level.
-What is the correct notation for the difference ?
(Multiple Choice)
4.8/5 (27)
Use the following information for questions:
Every student taking elementary statistics at a large university (1,100 students) participated in a class project by rolling a 6-sided die 100 times. Each individual student determined the proportion of his or her 100 rolls for which the result was a "1". The instructor plans to draw a histogram of the 1,100 sample proportions.
-What will be the approximate shape of this histogram?
(Multiple Choice)
4.9/5 (27)
Use the following information for questions:
For each study, decide if the two samples are :
-A random sample of high school seniors is asked how often (times per week) they eat at a fast-food restaurant. A year later, when the students are freshmen in college, they are asked the same question. The frequencies during the senior year of high school and the freshman year in college are compared.
(Multiple Choice)
4.7/5 (41)
Use the following information for questions:
A Statistics instructor asked a random sample of female and male students how many hours they exercise each week. Minitab output for a comparison of females and males is shown below. 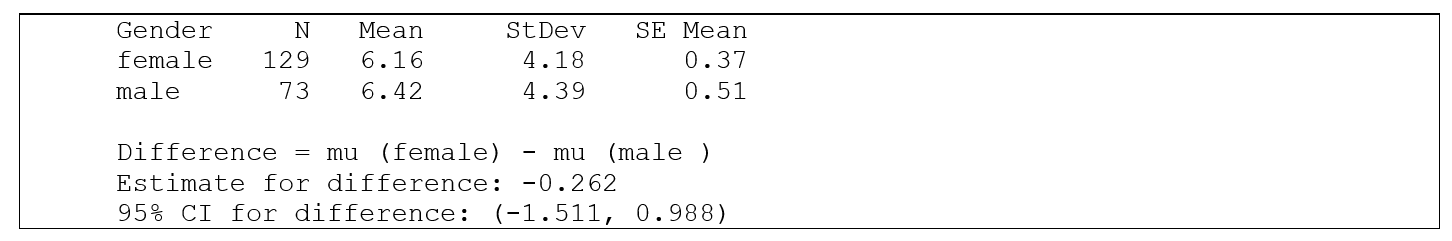 -This is an example of data collected using
(Multiple Choice)
4.9/5 (45)
Use the following information for questions:
A television station plans to ask a random sample of 400 city residents if they can name the news anchor on the evening news at their station. They plan to fire the news anchor if fewer than 10% of the residents in the sample can do so. Suppose that in fact 12% of city residents could name the anchor if asked.
-What is the approximate probability that the anchor will be fired?
(Multiple Choice)
4.9/5 (36)
Suppose that the mean of the sampling distribution for the difference in two sample means is 0. This tells us that
(Multiple Choice)
4.9/5 (43)
In a creek, the proportion of turtles that are snake-necked turtles is 35%. In a random sample of n = 50 turtles, the sample proportion of snake-necked turtles is 50%. What is the z-score associated with = 0.50?
(Short Answer)
4.9/5 (34)
Use the following information for questions:
Grade school students, especially the ones in higher grades, tend to spend a lot of time on the computer already. The average amount of time 4th grade boys spend on the computer is 5 hours per week, with a standard deviation of 1 hour. For 5th grade boys the average increases to 7 hours per week with a standard deviation of 1.5 hours. Random sample of 20 4th grade students and 25 5th grade students are to be selected.
-What is the probability that the difference between the sample means is greater than 1 hour?
(Short Answer)
4.8/5 (34)
Use the following information for questions:
In each situation, indicate whether it would make more sense to find a confidence interval for the population parameter or to conduct a hypothesis test for a specific null value.
-A weight-loss clinic wishes to determine how much more weight patients lose when they add both diet and exercise to their daily routines compared to when they just diet.
(Multiple Choice)
4.8/5 (34)
Use the following information for questions:
A candy factory makes 20% (p = 0.20) of all its candies with chocolate liquor. A random sample of n =100 candies is taken, and = proportion of candies in the sample made with chocolate liquor is calculated.
-What is the z-score for = 0.35?
(Multiple Choice)
4.9/5 (32)
Filters
- Essay(0)
- Multiple Choice(0)
- Short Answer(0)
- True False(0)
- Matching(0)