Exam 3: Descriptive Study of Bivariate Data
Exam 1: Introduction to Statistics17 Questions
Exam 2: Organization and Description of Data53 Questions
Exam 3: Descriptive Study of Bivariate Data44 Questions
Exam 4: Probability54 Questions
Exam 5: Probability Distributions49 Questions
Exam 6: The Normal Distribution32 Questions
Exam 7: Variation in Repeated Samplessampling Distributions31 Questions
Exam 8: Drawing Inferences From Large Samples48 Questions
Exam 9: Small Sample Inferences for Normal Populations36 Questions
Exam 10: Comparing Two Treatments37 Questions
Exam 11: Regression Analysis I29 Questions
Exam 12: Regression Analysis II Multiple Linear Regression and Other Topics5 Questions
Exam 13: Analysis of Categorical Data19 Questions
Exam 14: Analysis of Variance Anova16 Questions
Exam 15: Nonparametric Inference15 Questions
Select questions type
For one coastal state, there is a high correlation between ice cream sales and number of people swimming in the ocean. Suggest a possible lurking variable and explain what is meant by the term lurking variable.
(Essay)
4.9/5  (39)
(39)
A value of r really close to -1 means that the linear association ______.
(Multiple Choice)
4.7/5 (34)
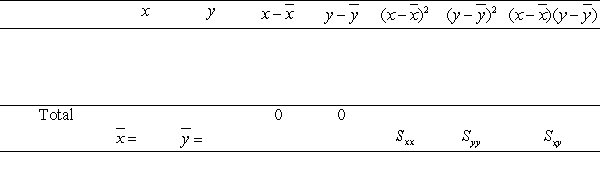
Consider the data set
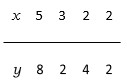 Calculate the
(a) sample means
(b) Sxx , Sxy , Syy
(c) sample correlation coefficient.
Calculate the
(a) sample means
(b) Sxx , Sxy , Syy
(c) sample correlation coefficient.
(Essay)
4.9/5 (35)
Consider the data set
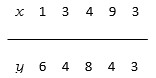 Calculate the
(a) sample means
(b)Sxx , Sxy , Syy
(c) sample correlation coefficient.
Calculate the
(a) sample means
(b)Sxx , Sxy , Syy
(c) sample correlation coefficient.
(Essay)
4.9/5 (42)
If all (x, y) values lie exactly on a straight line with a ______ slope, then r = +1.
(Short Answer)
4.9/5 (41)
A scientist in a center for disease control observes that the number of bacteria in a culture and air pollution in the city rise with time. Is there exists a lurking variable in this case?
(Short Answer)
4.9/5 (43)
Consider the data set
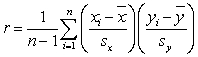
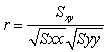
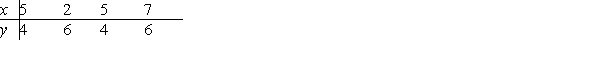 Find the sample correlation coefficient using the formula
 .
.
(Short Answer)
4.9/5 (34)
Consider the data set
 A) Complete the table.
 Use the formula
 to calculate the sample correlation. Round your answer to three decimal places.
(Essay)
4.8/5 (20)
Calculations from a data set of n = 36 pairs of (x, y) values have provided the following results.
 Obtain the correlation coefficient.
(Short Answer)
4.8/5 (41)
A line is determined by two constants. One of these constants is the ______, that is, the amount that y increases whenever x is increased by one unit.
(Short Answer)
4.9/5 (40)
The sign of the correlation coefficient r, indicates the weakness of a linear relation.
(True/False)
4.7/5 (41)
Consider the line
 A) What is its intercept?
B) What is its slope?
A) What is its intercept?
B) What is its slope?
(Short Answer)
4.9/5 (40)
A line is determined by two constants. One of these constants is the ______, that is, its height above the origin.
(Short Answer)
4.9/5 (40)
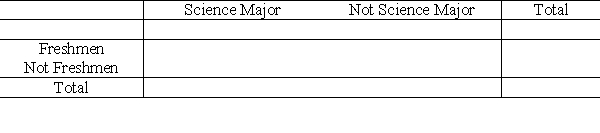
In a group of 180 college students, 43 are science majors, 66 are freshmen, and 31 are both. Based on these data, complete the following two-way frequency table.
(Essay)
4.8/5 (39)
Suppose from a data set of distance measurements in yards and time measurements in hours, the value of r is found to be 0.82. What would the value of r be if the distances were measured in feet and time in minutes.
(Multiple Choice)
4.8/5 (44)
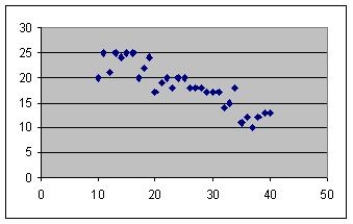
Is the correlation in the figure about
(a) .2, (b) -.4, (c) .4, (d) .8, or (e) -.9?
(Short Answer)
4.9/5 (43)
If the pattern of (x, y) values is a band that runs from ______ left to ______ right, then
r > 0.
(Short Answer)
4.9/5 (31)
Find the scatter diagram that corresponds to the correlation coefficient r = -.8.
(Multiple Choice)
4.8/5 (41)
Filters
- Essay(0)
- Multiple Choice(0)
- Short Answer(0)
- True False(0)
- Matching(0)