Exam 3: Descriptive Study of Bivariate Data
Exam 1: Introduction to Statistics17 Questions
Exam 2: Organization and Description of Data53 Questions
Exam 3: Descriptive Study of Bivariate Data44 Questions
Exam 4: Probability54 Questions
Exam 5: Probability Distributions49 Questions
Exam 6: The Normal Distribution32 Questions
Exam 7: Variation in Repeated Samplessampling Distributions31 Questions
Exam 8: Drawing Inferences From Large Samples48 Questions
Exam 9: Small Sample Inferences for Normal Populations36 Questions
Exam 10: Comparing Two Treatments37 Questions
Exam 11: Regression Analysis I29 Questions
Exam 12: Regression Analysis II Multiple Linear Regression and Other Topics5 Questions
Exam 13: Analysis of Categorical Data19 Questions
Exam 14: Analysis of Variance Anova16 Questions
Exam 15: Nonparametric Inference15 Questions
Select questions type
Calculations from a data set of n = 32 pairs of (x, y) values have provided the following results.
 Obtain the correlation coefficient.
(Short Answer)
4.9/5  (38)
(38)
An observed correlation between two variables may be caused by the influence of a third variable.
(True/False)
4.9/5 (30)
Classify the following statement as "single variable", "bivariate", or multivariate".
Age and weight of college students.
(Short Answer)
4.8/5 (42)
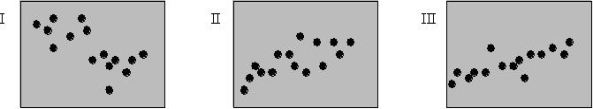
Match the following values of r with the correct diagrams. Write your answer in the form letter (A, B, or C) followed by the Roman numeral (I, II, or III).
(A) r = -.2, (B) r = .6, (C) r = .5
(Short Answer)
4.8/5 (35)
Filters
- Essay(0)
- Multiple Choice(0)
- Short Answer(0)
- True False(0)
- Matching(0)