Exam 2: Organization and Description of Data
Exam 1: Introduction to Statistics17 Questions
Exam 2: Organization and Description of Data53 Questions
Exam 3: Descriptive Study of Bivariate Data44 Questions
Exam 4: Probability54 Questions
Exam 5: Probability Distributions49 Questions
Exam 6: The Normal Distribution32 Questions
Exam 7: Variation in Repeated Samplessampling Distributions31 Questions
Exam 8: Drawing Inferences From Large Samples48 Questions
Exam 9: Small Sample Inferences for Normal Populations36 Questions
Exam 10: Comparing Two Treatments37 Questions
Exam 11: Regression Analysis I29 Questions
Exam 12: Regression Analysis II Multiple Linear Regression and Other Topics5 Questions
Exam 13: Analysis of Categorical Data19 Questions
Exam 14: Analysis of Variance Anova16 Questions
Exam 15: Nonparametric Inference15 Questions
Select questions type
If M is the mean of x1, x2, and x3, then the mean of 50x1, 50x2, and 50x3 is 50M.
(True/False)
4.9/5  (31)
(31)
Consider the data
6 4 8 4 3
concerning the number of visits by five students to a fast food establishment in the last 30 days,
Calculate the
(a) sample mean
(b) deviations x - x and check to see that they add up to 0.
(c) sample variance. Give the units of variance.
(d) sample standard deviation.
(Short Answer)
4.9/5 (38)
If the median of the following set of data is 11.1, find the value of x.
12.9 8.4 x 10.6
(Multiple Choice)
4.8/5 (44)
During a recent season, the Orlando Magics basketball team won 59 games. The diference in points for 24 of these games is shown below. Find the time plot that corresponds to these data.

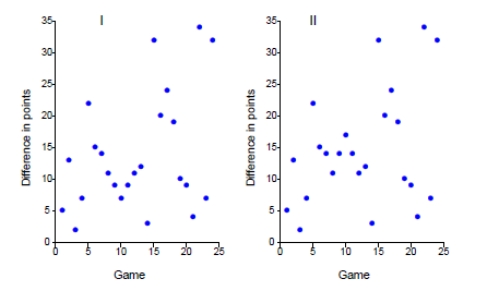
(Short Answer)
5.0/5 (39)
The second quartile of a data set always corresponds to the mean.
(True/False)
4.9/5 (35)
The range is the difference between the largest observation and the smallest observation.
(True/False)
4.7/5 (50)
The measurement scale for a ______ variable does not have gaps.
(Short Answer)
4.8/5 (41)
The number of bachelor's degrees earned in the United States, over
a recent 20-year period are given in the following table. The number is
presented in millions of degrees.
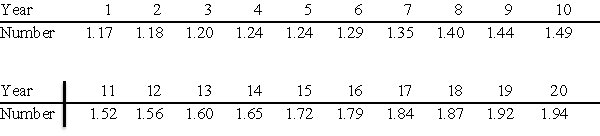 Select the time plot of the number of bachelor's degrees.
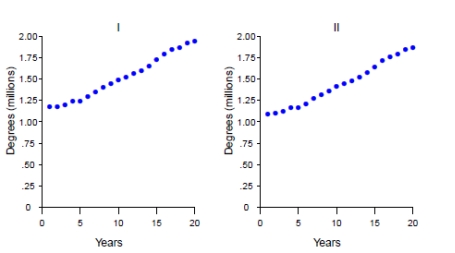
(Short Answer)
4.7/5 (44)
Filters
- Essay(0)
- Multiple Choice(0)
- Short Answer(0)
- True False(0)
- Matching(0)