Exam 2: Organization and Description of Data
Exam 1: Introduction to Statistics17 Questions
Exam 2: Organization and Description of Data53 Questions
Exam 3: Descriptive Study of Bivariate Data44 Questions
Exam 4: Probability54 Questions
Exam 5: Probability Distributions49 Questions
Exam 6: The Normal Distribution32 Questions
Exam 7: Variation in Repeated Samplessampling Distributions31 Questions
Exam 8: Drawing Inferences From Large Samples48 Questions
Exam 9: Small Sample Inferences for Normal Populations36 Questions
Exam 10: Comparing Two Treatments37 Questions
Exam 11: Regression Analysis I29 Questions
Exam 12: Regression Analysis II Multiple Linear Regression and Other Topics5 Questions
Exam 13: Analysis of Categorical Data19 Questions
Exam 14: Analysis of Variance Anova16 Questions
Exam 15: Nonparametric Inference15 Questions
Select questions type
A die is rolled 16 times, the scores are shown below.
 a) Find the frequency of even numbers.
b) Find the relative frequency of even numbers. Round your answer to three decimal places.
a) Find the frequency of even numbers.
b) Find the relative frequency of even numbers. Round your answer to three decimal places.
(Short Answer)
4.8/5  (32)
(32)
According to the empirical guidelines for symmetric bell-shaped distributions, approximately 95% of the data lie within

(True/False)
4.7/5 (28)
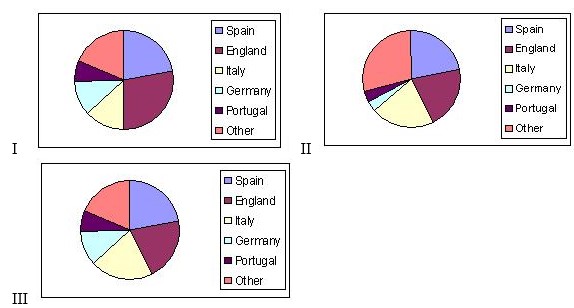
The following table shows the countries whose teams have won the UEFA Champions League.
 a) Calculate the relative frequency of each country. Round your answers to three decimal places
b) Select the pie chart that better describes the data.
a) Calculate the relative frequency of each country. Round your answers to three decimal places
b) Select the pie chart that better describes the data.
(Short Answer)
4.7/5 (38)
The stem-and-leaf display given here shows the final examination scores of students in a statistics course. (Leaf unit = 1.0)
 a) Find the median score.
b) Find the quartiles Q1 and Q3.
c) What proportion of the students scored below 70? Round your answer to three decimal places.
a) Find the median score.
b) Find the quartiles Q1 and Q3.
c) What proportion of the students scored below 70? Round your answer to three decimal places.
(Short Answer)
5.0/5 (36)
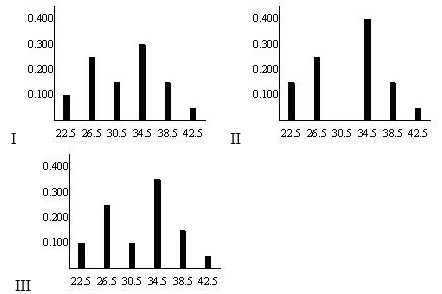
Let s1, s2, and s3 be the standard deviations of the bell-shaped graphs I, II, and III, respectively. Place them in increasing order. 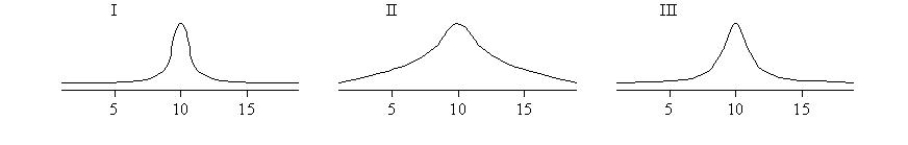
(Multiple Choice)
4.9/5 (36)
Since the median is not affected by a few very small or very large observations, the _______ is likely to be a more sensible measure of center than the ________.
(Short Answer)
4.7/5 (37)
For the data set
 a) Calculate the deviations (X-X̄) and check to see that they add up to 0.
b) Calculate the sample variance and the standard deviation.
a) Calculate the deviations (X-X̄) and check to see that they add up to 0.
b) Calculate the sample variance and the standard deviation.
(Essay)
4.9/5 (35)
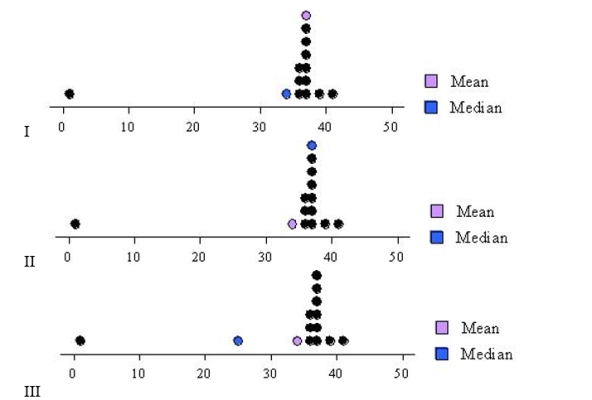
In a period of twelve years, the record low temperatures ( F) in Los Angeles CA were:
 Find the dot diagram that corresponds to these data.
(Short Answer)
4.8/5 (44)
For the data set
 calculate s2 by using the alternative formula. Round your answer to the nearest tenth.
(Short Answer)
4.9/5 (42)
The number of touchdowns of a college football team is:
 a) Complete the frequency distribution.
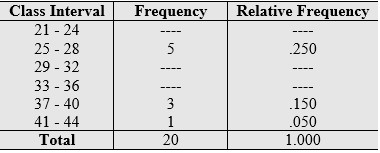 b) Select the line diagram that matches the data.
(Essay)
4.7/5 (32)
A die is rolled 16 times, the scores are shown below.
 a) Find the frequency of 5.
b) Find the relative frequency of 5. Round your answer to four decimal places.
a) Find the frequency of 5.
b) Find the relative frequency of 5. Round your answer to four decimal places.
(Short Answer)
4.8/5 (34)
Use the stem-and-leaf display to construct a frequency distribution with intervals 10-12, 13-15, ..., 25-27.

(Essay)
4.9/5 (28)
Three friends eat out together once a week and they split the bill so each pays x dollars. Because the same person always orders much more than the other two, they decide it is much fairer to each pay the median of the three meals. Is there anything wrong with this plan?
(Essay)
4.8/5 (42)
A die is rolled 16 times, the scores are shown below.
 a) Find the frequency of numbers larger than 4.
b) Find the relative frequency of numbers larger than 4. Round your answer to four decimal places.
a) Find the frequency of numbers larger than 4.
b) Find the relative frequency of numbers larger than 4. Round your answer to four decimal places.
(Short Answer)
4.8/5 (37)
The table below shows the fastest race lap in the F1 Grand Prix in Monza.
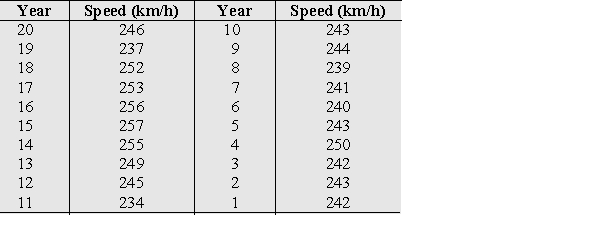 Make a stem-and-leaf display with a 2-digit stem.
(Essay)
4.9/5 (28)
Filters
- Essay(0)
- Multiple Choice(0)
- Short Answer(0)
- True False(0)
- Matching(0)