Exam 4: Enhancing a Workbook With Charts and Graphs
Exam 1: Getting Started With Excel150 Questions
Exam 2: Formatting a Workbook150 Questions
Exam 3: Working With Formulas and Functions150 Questions
Exam 4: Enhancing a Workbook With Charts and Graphs150 Questions
Exam 5: Working With Excel Tables, Pivot-tables, and Pivot-charts150 Questions
Exam 6: Managing Multiple Worksheets and Workbooks150 Questions
Exam 7: Using Advanced Functions and Conditional Formatting150 Questions
Exam 8: Developing an Excel Application150 Questions
Exam 9: Working With Financial Tools and Functions150 Questions
Exam 10: Performing What-If Analyses150 Questions
Exam 11: Connecting to External Data150 Questions
Exam 12: Expanding Excel With Visual Basic for Applications150 Questions
Exam 13: Managing Your Files150 Questions
Exam 14: Getting Started With Microsoft Office 2010150 Questions
Select questions type
In the figure above,the value axis entries on the "Fund History" chart,are displayed with the ____ unit.
(Multiple Choice)
4.8/5  (42)
(42)
One of Edward Tufte's most important works is The Visual Display of Quantitative Information in which he laid out several principles for the design of charts and graphics.
(True/False)
5.0/5 (38)
One advantage of breaking up a sparkline group is that Excel can display each sparkline based on the ____ values associated with the individual sparkline's data series.
(Multiple Choice)
4.8/5 (29)
Each data source is a collection of ____________________,which is a range of values plotted as a single unit on a chart.
(Short Answer)
4.9/5 (38)
Because of the visual distortion that can result with 3-D charts,you should ____.
(Multiple Choice)
4.7/5 (32)
To change a border color on a chart,click the Color button to open the color palette.
(True/False)
4.8/5 (40)
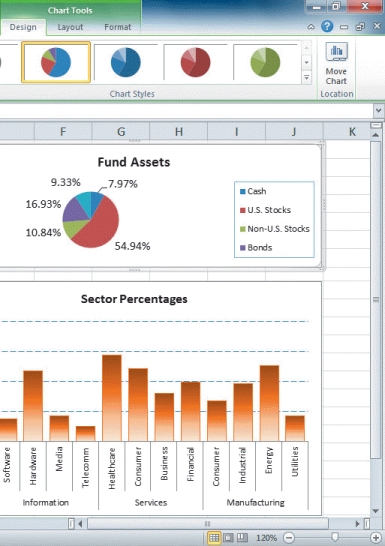 -Referring to the figure above,the chart title for the pie chart is ____.
(Multiple Choice)
4.9/5 (34)
By default,embedded charts display the chart and any text or figures on separate pages.
(True/False)
4.7/5 (36)
When selecting a data source for a pie chart,select all rows and columns,including total rows and columns.
(True/False)
4.8/5 (38)
Filters
- Essay(0)
- Multiple Choice(0)
- Short Answer(0)
- True False(0)
- Matching(0)