Exam 4: Enhancing a Workbook With Charts and Graphs
Exam 1: Getting Started With Excel150 Questions
Exam 2: Formatting a Workbook150 Questions
Exam 3: Working With Formulas and Functions150 Questions
Exam 4: Enhancing a Workbook With Charts and Graphs150 Questions
Exam 5: Working With Excel Tables, Pivot-tables, and Pivot-charts150 Questions
Exam 6: Managing Multiple Worksheets and Workbooks150 Questions
Exam 7: Using Advanced Functions and Conditional Formatting150 Questions
Exam 8: Developing an Excel Application150 Questions
Exam 9: Working With Financial Tools and Functions150 Questions
Exam 10: Performing What-If Analyses150 Questions
Exam 11: Connecting to External Data150 Questions
Exam 12: Expanding Excel With Visual Basic for Applications150 Questions
Exam 13: Managing Your Files150 Questions
Exam 14: Getting Started With Microsoft Office 2010150 Questions
Select questions type
To add an axis to a sparkline,click the Axis button in the ____ group on the Sparkline Tools Design tab,and then click Show Axis.
(Multiple Choice)
4.9/5  (33)
(33)
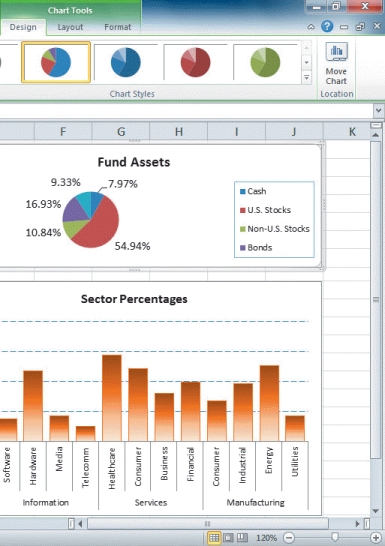 -Referring to the figure above,the rectangular area to the right of the pie chart (listing Cash,U.S.Stocks,Non-U.S.Stocks,and Bonds)is the ____.
(Multiple Choice)
4.9/5 (33)
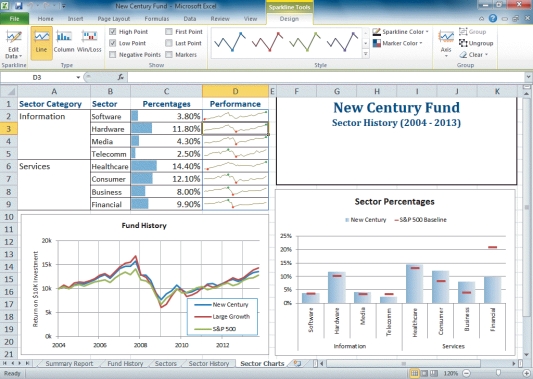 -In the above figure,the data markers shown in the cells in the column labeled "Performance," are ____.
(Multiple Choice)
4.9/5 (33)
In Excel,charts do not remain linked or connected to their data sources if they appear in different worksheets.
(True/False)
4.8/5 (29)
After you select the data source,Excel determines the series name,series values,and category values based on the data source._________________________
(True/False)
4.9/5 (39)
Which of the following represents a range of data in Excel?
(Multiple Choice)
4.8/5 (34)
If you cannot find the right chart to meet your needs,Excel allows you to create a custom chart based on the built-in chart types.
(True/False)
4.8/5 (40)
Which of the following represents the pointer when it is over a blank spot in the chart legend?
(Multiple Choice)
4.8/5 (28)
Placing a chart in a ____ displays only the chart and no worksheet cells.
(Multiple Choice)
4.8/5 (37)
MATCHING
Identify the letter of the choice that best matches the phrase or definition.
-Another term for Scatter chart
(Multiple Choice)
4.8/5 (34)
Anya needs to call attention to one category above all others.For this purpose,she should use a(n)____.
(Multiple Choice)
4.8/5 (35)
To create a combination chart,you select a data series in an existing chart,and then apply a new ___________________ to that series.
(Short Answer)
4.9/5 (38)
Explain when it would be appropriate to use a chart sheet and how you would go about creating one in Microsoft Excel.
(Essay)
5.0/5 (35)
Anya tells you that she is using a 3-D chart for the first time and asks if you have any advice for this chart type.You should tell Anya that it's especially important to ____ in 3-D charts.
(Multiple Choice)
4.9/5 (39)
The lengths of data bars are based on the value of each cell in the selected range.
(True/False)
4.9/5 (40)
Consider the impact of a poorly designed chart.Explain why it is important to have a well-designed chart,and name at least four tips for creating a good chart.
(Essay)
4.8/5 (40)
Filters
- Essay(0)
- Multiple Choice(0)
- Short Answer(0)
- True False(0)
- Matching(0)