Exam 19: Statistical Process Control and Quality Management
Exam 1: What Is Statistics79 Questions
Exam 2: Describing Data: Frequency Tables, Frequency Distributions, and Graphic Presentation129 Questions
Exam 3: Describing Data: Numerical Measures132 Questions
Exam 4: Describing Data: Displaying and Exploring Data108 Questions
Exam 5: A Survey of Probability Concepts130 Questions
Exam 6: Discrete Probability Distributions128 Questions
Exam 7: Continuous Probability Distributions131 Questions
Exam 8: Sampling Methods and the Central Limit Theorem115 Questions
Exam 9: Estimation and Confidence Intervals129 Questions
Exam 10: One-Sample Tests of Hypothesis134 Questions
Exam 11: Two-Sample Tests of Hypothesis130 Questions
Exam 12: Analysis of Variance128 Questions
Exam 13: Correlation and Linear Regression130 Questions
Exam 14: Multiple Regression Analysis129 Questions
Exam 15: Index Numbers129 Questions
Exam 16: Time Series and Forecasting129 Questions
Exam 17: Nonparametric Methods: Goodness-Of-Fit Tests129 Questions
Exam 18: Nonparametric Methods: Analysis of Ranked Data129 Questions
Exam 19: Statistical Process Control and Quality Management129 Questions
Exam 20: An Introduction to Decision Theory115 Questions
Select questions type
A major distributor buys shoes from a supplier. The distributor randomly samples the shoes to inspect for quality. The distributor's specifications state that a delivery of 50 pairs of shoes will be accepted only if the number of defective pairs of shoes in a sample of 5 pairs is two or less. Based on the sampling plan, what is the probability of accepting the delivery of 50 pairs of shoes if the actual percent defective is 0.40?
(Short Answer)
4.8/5  (39)
(39)
In what decade were the concepts of statistical quality control developed? _________
(Short Answer)
4.9/5 (30)
A new machine is set or calibrated to fill tubes of toothpaste at precisely 6.75 ounces. Then, once the machine is running, a sample of 6 tubes is taken every three hours and weighed with the following results:  What is the value of the lower control factor of the range?
(Multiple Choice)
4.9/5 (29)
A new machine used in the production of motor mount bolts was put into operation. Five samples of size 100 were randomly selected and the number of defectives in each sample was noted. 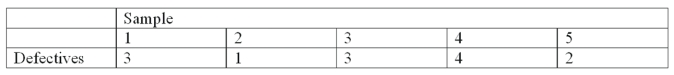 The measurement of quality is based on
(Multiple Choice)
4.9/5 (36)
A new machine is set or calibrated to fill tubes of toothpaste at precisely 6.75 ounces. Then, once the machine is running, a sample of 6 tubes is taken every three hours and weighed with the following results: 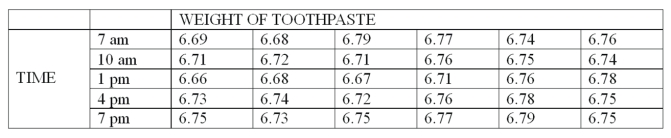 What is the lower control limit for the mean?
(Multiple Choice)
4.7/5 (28)
There are two general types of causes of variations in manufacturing and service processes: chance and assignable causes.
(True/False)
4.9/5 (36)
A Pareto chart is useful because it is based on the theory that 80% of the observations are accounted for by 20% of the ________.
(Short Answer)
4.8/5 (33)
A quality control chart is used to monitor the customer wait time at a local call center. Sample means of five times are averaged and plotted over time. The last five sample means show a trend of decreasing sample means. The process is
(Multiple Choice)
4.8/5 (29)
What chart helps to identify the relatively few factors that impact the performance of a manufacturing or service process?
(Multiple Choice)
4.9/5 (30)
An airline is investigating the causes of lost bags. The following table of data was collected over the last six months. 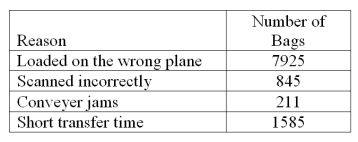 What is the reason with the highest percentage of bags is lost, and what is the percentage?
(Short Answer)
4.7/5 (36)
A manufacturer of cell phones counts the number of defective phones in an eight hour shift. Over the last ten days, the number of defective shafts per eight hour shift has been reported. 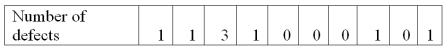 To construct a process control chart for the mean number defective, what is the upper control limit?
(Short Answer)
5.0/5 (37)
A new printing machine is set or calibrated to print 25 copies per minute. On each of four days, the printer's output is measured five times. The data will be used to construct a process control chart to monitor the printing process. The results of the printing process are in the following table. 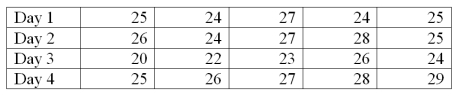 What is the upper control limit (UCL) for the mean chart?
(Short Answer)
4.9/5 (32)
Random samples of 4 items are selected from a manufacturing process at regular intervals and a certain quality characteristic is measured. After 25 samples, X = 15,350 and R = 411.4
To construct a range chart, what is the upper control limit (UCL) for the range?
(Multiple Choice)
4.7/5 (31)
Pareto charts are based on the 80-20 rule, which says, 80% of the factors cause 20% of the problem.
(True/False)
4.8/5 (36)
Random samples of 4 items are selected from a manufacturing process at regular intervals and a certain quality characteristic is measured. After 25 samples, 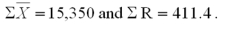 How many samples were collected?
(Multiple Choice)
4.7/5 (41)
Which chart portrays the number of defects per unit of production? _____________
(Short Answer)
4.8/5 (40)
An airline is investigating the causes of lost bags. The following table of data was collected over the last six months. 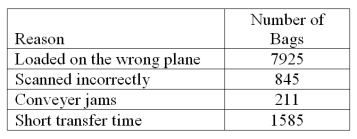 What is the reason with the lowest percentage of bags is lost, and what is the percentage?
(Short Answer)
4.8/5 (37)
Filters
- Essay(0)
- Multiple Choice(0)
- Short Answer(0)
- True False(0)
- Matching(0)