Exam 19: Statistical Process Control and Quality Management
Exam 1: What Is Statistics79 Questions
Exam 2: Describing Data: Frequency Tables, Frequency Distributions, and Graphic Presentation129 Questions
Exam 3: Describing Data: Numerical Measures132 Questions
Exam 4: Describing Data: Displaying and Exploring Data108 Questions
Exam 5: A Survey of Probability Concepts130 Questions
Exam 6: Discrete Probability Distributions128 Questions
Exam 7: Continuous Probability Distributions131 Questions
Exam 8: Sampling Methods and the Central Limit Theorem115 Questions
Exam 9: Estimation and Confidence Intervals129 Questions
Exam 10: One-Sample Tests of Hypothesis134 Questions
Exam 11: Two-Sample Tests of Hypothesis130 Questions
Exam 12: Analysis of Variance128 Questions
Exam 13: Correlation and Linear Regression130 Questions
Exam 14: Multiple Regression Analysis129 Questions
Exam 15: Index Numbers129 Questions
Exam 16: Time Series and Forecasting129 Questions
Exam 17: Nonparametric Methods: Goodness-Of-Fit Tests129 Questions
Exam 18: Nonparametric Methods: Analysis of Ranked Data129 Questions
Exam 19: Statistical Process Control and Quality Management129 Questions
Exam 20: An Introduction to Decision Theory115 Questions
Select questions type
If a company reports that its quarterly earnings will be between $100 million and $125 million, the range is an example of _________ variation.
(Multiple Choice)
4.9/5  (26)
(26)
A c bar chart shows the percent of the production that is defective.
(True/False)
4.9/5 (35)
The manager of a restaurant inspects a delivery of steaks based on the expectation that each steak weighs eight ounces. Is this an example of acceptance sampling or statistical process control? Explain why.
(Essay)
4.8/5 (37)
What is the purpose of a statistical control chart that plots sample means? _______________________________
(Short Answer)
4.9/5 (26)
If the sample ranges fall randomly within the upper and lower control limits, then it can be assumed that the process is ___________.
(Short Answer)
4.7/5 (30)
A manufacturer of golf club shafts inspects fifty shafts every day. Over the last ten days, the number of defective shafts has been reported.  To construct a process control chart for the mean percent defective, what is the upper control limit?
(Short Answer)
4.7/5 (27)
A new machine is set or calibrated to fill tubes of toothpaste at precisely 6.75 ounces. Then, once the machine is running, a sample of 6 tubes is taken every three hours and weighed with the following results: 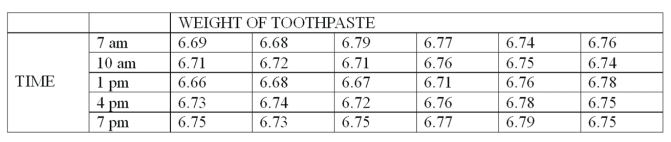 The measurement of quality is based on
(Multiple Choice)
4.7/5 (30)
A statistical quality control chart that is out-of-control shows what type of variation? _______
(Short Answer)
4.7/5 (30)
What process investigates the potential causes of an outcome or effect such as poor quality?
(Multiple Choice)
4.9/5 (37)
Which probability distribution is used to develop an operating characteristic curve?
(Multiple Choice)
4.8/5 (30)
If the binomial distribution is used to develop an operating characteristic curve for an acceptance sampling plan, how many possible outcomes can there be? _______
(Short Answer)
4.8/5 (35)
A manufacturer of cell phones counts the number of defective phones in an eight hour shift. Over the last ten days, the number of defective shafts per eight hour shift has been reported. 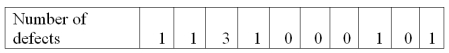 To construct a process control chart for the mean number defective, what is the lower control limit?
(Short Answer)
4.9/5 (31)
A manufacturer of golf club shafts inspects fifty shafts every day. Over the last ten days, the number of defective shafts has been reported. 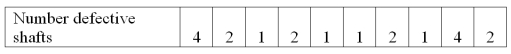 To construct a process control chart for the mean percent defective, what is the lower control limit?
(Short Answer)
4.8/5 (31)
Samples of 200 parts were taken every day and the number of defectives was counted. What are the upper and lower limits for the percent defective chart? 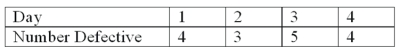
(Multiple Choice)
4.9/5 (37)
Control charts can be developed for both variables and attributes.
(True/False)
4.7/5 (32)
A new printing machine is set or calibrated to print 25 copies per minute. On each of four days, the printer's output is measured five times. The data will be used to construct a process control chart to monitor the printing process. The results of the printing process are in the following table. 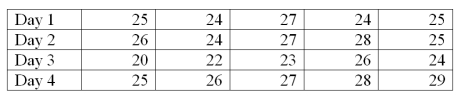 What is the value of the upper control limit factor for a range chart?
(Short Answer)
4.8/5 (34)
Assignable causes are usually large in number and random in nature, and they cannot be entirely eliminated.
(True/False)
5.0/5 (29)
Filters
- Essay(0)
- Multiple Choice(0)
- Short Answer(0)
- True False(0)
- Matching(0)