Exam 19: Statistical Process Control and Quality Management
Exam 1: What Is Statistics79 Questions
Exam 2: Describing Data: Frequency Tables, Frequency Distributions, and Graphic Presentation129 Questions
Exam 3: Describing Data: Numerical Measures132 Questions
Exam 4: Describing Data: Displaying and Exploring Data108 Questions
Exam 5: A Survey of Probability Concepts130 Questions
Exam 6: Discrete Probability Distributions128 Questions
Exam 7: Continuous Probability Distributions131 Questions
Exam 8: Sampling Methods and the Central Limit Theorem115 Questions
Exam 9: Estimation and Confidence Intervals129 Questions
Exam 10: One-Sample Tests of Hypothesis134 Questions
Exam 11: Two-Sample Tests of Hypothesis130 Questions
Exam 12: Analysis of Variance128 Questions
Exam 13: Correlation and Linear Regression130 Questions
Exam 14: Multiple Regression Analysis129 Questions
Exam 15: Index Numbers129 Questions
Exam 16: Time Series and Forecasting129 Questions
Exam 17: Nonparametric Methods: Goodness-Of-Fit Tests129 Questions
Exam 18: Nonparametric Methods: Analysis of Ranked Data129 Questions
Exam 19: Statistical Process Control and Quality Management129 Questions
Exam 20: An Introduction to Decision Theory115 Questions
Select questions type
A subassembly is inspected and the number of defects recorded. A new group of assemblers began work Monday morning. The number of defects per subassembly for the first 10 they produced was: 3, 2, 0, 5, 4, 6, 0, 7, 7, and 6. What are the upper and lower limits for the c bar chart?
(Multiple Choice)
4.9/5  (40)
(40)
The manager of a restaurant measures several variables important to quality. These include: food temperature, time to complete an order, and number of times a server visits a table. These variables are graphed over time. Is this an example of acceptance sampling or statistical process control?
(Essay)
4.8/5 (18)
An airline is investigating the causes of lost bags. The following table of data was collected over the last six months. 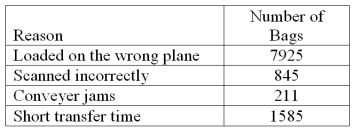 What percentage of bags is lost because of "conveyer jams"?
(Short Answer)
4.8/5 (33)
Random samples of 4 items are selected from a manufacturing process at regular intervals and a certain quality characteristic is measured. After 25 samples, X = 15,350 and R = 411.4
The measurement of quality is based on
(Multiple Choice)
4.7/5 (36)
What is the process that insures that a company is producing a quality product or service?
(Multiple Choice)
5.0/5 (33)
A new printing machine is set or calibrated to print 25 copies per minute. On each of four days, the printer's output is measured five times. The data will be used to construct a process control chart to monitor the printing process. The results of the printing process are in the following table. 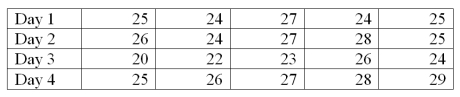 What is the range of the samples on Day 3?
(Short Answer)
4.9/5 (44)
A sampling plan states that if 20 incoming transistors are checked and 2 or less defects are found that the lot is accepted. If an incoming lot is 10 percent defective, what is the probability of accepting the lot of transistors?
(Multiple Choice)
4.8/5 (32)
If the upper and lower control limits are set at 3 standard deviations from the mean, we would expect that
(Multiple Choice)
4.9/5 (43)
A quality control chart is used to monitor the customer wait time at a local call center. Sample means of five times are averaged and plotted over time. Over the last hundred sample means, one sample mean was outside a control limit. The chart shows
(Multiple Choice)
4.8/5 (33)
Percent defective charts, which are also known as P charts or p bar charts, show the percent of the production that is or is not acceptable.
(True/False)
4.7/5 (37)
A new machine is set or calibrated to fill tubes of toothpaste at precisely 6.75 ounces. Then, once the machine is running, a sample of 6 tubes is taken every three hours and weighed with the following results: 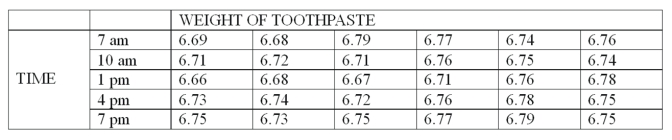 What is X bar for 7 pm?
(Multiple Choice)
4.9/5 (40)
A new machine is set or calibrated to fill tubes of toothpaste at precisely 6.75 ounces. Then, once the machine is running, a sample of 6 tubes is taken every three hours and weighed with the following results: 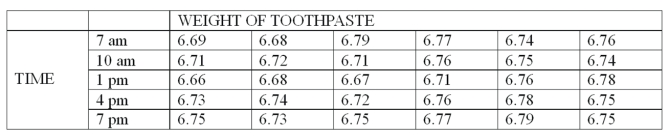 What is the value for the lower control limit (LCL) of the range?
(Multiple Choice)
4.8/5 (34)
Which probability distribution is used to develop a percent defective chart?
(Multiple Choice)
4.8/5 (45)
A new machine is set or calibrated to fill tubes of toothpaste at precisely 6.75 ounces. Then, once the machine is running, a sample of 6 tubes is taken every three hours and weighed with the following results: 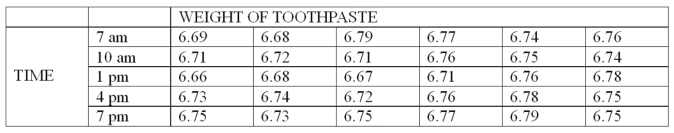 What is the mean range?
(Multiple Choice)
4.9/5 (30)
In a fishbone diagram, "dissatisfied customers" would be an _________ and "slow service" would be a _________.
(Short Answer)
4.9/5 (38)
Quality control charts indicate whether a production process is in-control or out-of-control.
(True/False)
4.8/5 (34)
In an acceptance sampling plan, what happens to the incoming lot if the number of defective items in the sample is less than or equal to the acceptance number? __________________
(Short Answer)
4.9/5 (38)
A major distributor buys shoes from a supplier. The distributor randomly samples the shoes to inspect for quality. The distributor's specifications state that a delivery of 100 pairs of shoes will be accepted only if the number of defective pairs of shoes in a sample of 10 pairs is two or less. Based on the sampling plan, what is the probability of accepting the delivery of 100 pairs of shoes if the actual percent defective is 0.10?
(Short Answer)
4.8/5 (40)
In acceptance sampling, it is possible that an incoming lot of computer chips contains more defective chips than it should, but it is accepted. In acceptance sampling, what is this probability called? _______
(Short Answer)
4.8/5 (44)
Filters
- Essay(0)
- Multiple Choice(0)
- Short Answer(0)
- True False(0)
- Matching(0)