Exam 19: Statistical Process Control and Quality Management
Exam 1: What Is Statistics79 Questions
Exam 2: Describing Data: Frequency Tables, Frequency Distributions, and Graphic Presentation129 Questions
Exam 3: Describing Data: Numerical Measures132 Questions
Exam 4: Describing Data: Displaying and Exploring Data108 Questions
Exam 5: A Survey of Probability Concepts130 Questions
Exam 6: Discrete Probability Distributions128 Questions
Exam 7: Continuous Probability Distributions131 Questions
Exam 8: Sampling Methods and the Central Limit Theorem115 Questions
Exam 9: Estimation and Confidence Intervals129 Questions
Exam 10: One-Sample Tests of Hypothesis134 Questions
Exam 11: Two-Sample Tests of Hypothesis130 Questions
Exam 12: Analysis of Variance128 Questions
Exam 13: Correlation and Linear Regression130 Questions
Exam 14: Multiple Regression Analysis129 Questions
Exam 15: Index Numbers129 Questions
Exam 16: Time Series and Forecasting129 Questions
Exam 17: Nonparametric Methods: Goodness-Of-Fit Tests129 Questions
Exam 18: Nonparametric Methods: Analysis of Ranked Data129 Questions
Exam 19: Statistical Process Control and Quality Management129 Questions
Exam 20: An Introduction to Decision Theory115 Questions
Select questions type
A new printing machine is set or calibrated to print 25 copies per minute. On each of four days, the printer's output is measured five times. The data will be used to construct a process control chart to monitor the printing process. The results of the printing process are in the following table. 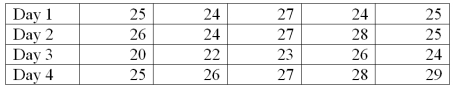 What is the mean for Day 1?
(Short Answer)
4.9/5  (34)
(34)
A fishbone diagram classifies potential causes into categories. What are they?
(Multiple Choice)
4.8/5 (33)
Random samples of 4 items are selected from a manufacturing process at regular intervals and a certain quality characteristic is measured. After 25 samples, X = 15,350 and R = 411.4
To construct a mean chart, what is the value for R bar used to compute the limits?
(Multiple Choice)
4.7/5 (32)
Mean charts are designed to determine whether a process is in or out of control based on sample means.
(True/False)
4.8/5 (32)
A new machine used in the production of motor mount bolts was put into operation. Five samples of size 100 were randomly selected and the number of defectives in each sample was noted. 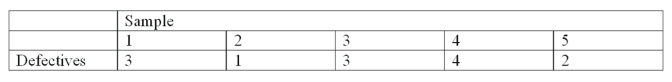 What is the upper control limit (UCL)?
(Multiple Choice)
4.9/5 (39)
A manufacturer of cell phones counts the number of defective phones in an eight hour shift. Over the last ten days, the number of defective shafts per eight hour shift has been reported. 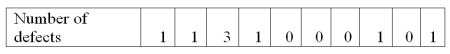 What is the average number of defects per eight hour shift?
(Short Answer)
4.8/5 (38)
In acceptance sampling, there is one unique operating characteristic curve for a specified sampling plan.
(True/False)
4.8/5 (40)
Cappelli Inc. designs and manufactures women's apparel using material from various mills. Their acceptance sampling plan states that 20 two inch squares of the incoming material must be carefully checked. If 3 or less squares reveal imperfections, the lot is accepted. What is the probability that an incoming lot from Blufton Mills that contains 40 percent imperfect cloth will be accepted?
(Multiple Choice)
4.9/5 (32)
A manufacturer of golf club shafts inspects fifty shafts every day. Over the last ten days, the number of defective shafts has been reported. 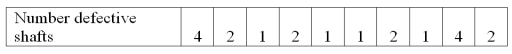 What is the mean proportion of defective shafts?
(Short Answer)
4.8/5 (42)
A quality control chart is used to monitor the customer wait time at a local call center. Sample means of five times are averaged and plotted over time. The last five sample means show a trend of increasing sample means. The process is
(Multiple Choice)
4.8/5 (31)
What variation is due to slight changes in materials or process conditions and is random in nature? ________________
(Short Answer)
4.9/5 (42)
A new machine is set or calibrated to fill tubes of toothpaste at precisely 6.75 ounces. Then, once the machine is running, a sample of 6 tubes is taken every three hours and weighed with the following results: 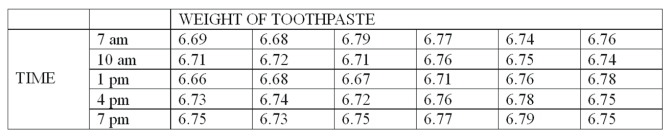 What is the range of the samples at 4 pm?
(Multiple Choice)
4.8/5 (33)
Random samples of 4 items are selected from a manufacturing process at regular intervals and a certain quality characteristic is measured. After 25 samples, X = 15,350 and R = 411.4
To construct a range chart, what is the lower control limit (LCL) for the range?
(Multiple Choice)
4.8/5 (33)
A fishbone diagram is used to determine if a process is out of control.
(True/False)
4.8/5 (30)
A new printing machine is set or calibrated to print 25 copies per minute. On each of four days, the printer's output is measured five times. The data will be used to construct a process control chart to monitor the printing process. The results of the printing process are in the following table. 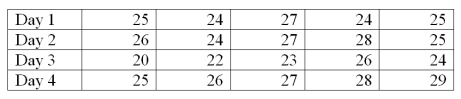 What is the lower control limit (LCL) for the mean chart?
(Short Answer)
4.9/5 (34)
Random samples of 4 items are selected from a manufacturing process at regular intervals and a certain quality characteristic is measured. After 25 samples, X = 15,350 and R = 411.4
To construct a mean chart what is the value for the center line?
(Multiple Choice)
4.8/5 (34)
Random samples of 4 items are selected from a manufacturing process at regular intervals and a certain quality characteristic is measured. After 25 samples, X = 15,350 and R = 411.4
To construct a mean chart, what is the upper control limit (UCL) for the mean?
(Multiple Choice)
4.8/5 (34)
Random samples of 4 items are selected from a manufacturing process at regular intervals and a certain quality characteristic is measured. After 25 samples, X = 15,350 and R = 411.4
To construct a mean chart, what is the lower control limit (LCL) for the mean?
(Multiple Choice)
4.9/5 (41)
A manufacturer of golf club shafts inspects fifty shafts every day. Over the last ten days, the number of defective shafts has been reported. 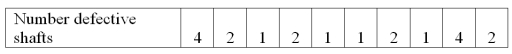 What is the standard error of the mean proportion of defective shafts?
(Short Answer)
4.8/5 (28)
Filters
- Essay(0)
- Multiple Choice(0)
- Short Answer(0)
- True False(0)
- Matching(0)