Exam 17: Nonparametric Methods: Goodness-Of-Fit Tests
Exam 1: What Is Statistics79 Questions
Exam 2: Describing Data: Frequency Tables, Frequency Distributions, and Graphic Presentation129 Questions
Exam 3: Describing Data: Numerical Measures132 Questions
Exam 4: Describing Data: Displaying and Exploring Data108 Questions
Exam 5: A Survey of Probability Concepts130 Questions
Exam 6: Discrete Probability Distributions128 Questions
Exam 7: Continuous Probability Distributions131 Questions
Exam 8: Sampling Methods and the Central Limit Theorem115 Questions
Exam 9: Estimation and Confidence Intervals129 Questions
Exam 10: One-Sample Tests of Hypothesis134 Questions
Exam 11: Two-Sample Tests of Hypothesis130 Questions
Exam 12: Analysis of Variance128 Questions
Exam 13: Correlation and Linear Regression130 Questions
Exam 14: Multiple Regression Analysis129 Questions
Exam 15: Index Numbers129 Questions
Exam 16: Time Series and Forecasting129 Questions
Exam 17: Nonparametric Methods: Goodness-Of-Fit Tests129 Questions
Exam 18: Nonparametric Methods: Analysis of Ranked Data129 Questions
Exam 19: Statistical Process Control and Quality Management129 Questions
Exam 20: An Introduction to Decision Theory115 Questions
Select questions type
Six people have declared their intentions to run for a seat on the school board in the next local election. A poll is conducted during the campaign among 1,020 randomly sampled voters to determine if there is any clear preference among the voters. The responses are shown below.  What is the critical value at the 5% level of significance?
(Short Answer)
4.7/5  (33)
(33)
If we wanted to see if tossing a die (a cube with the sides numbered one through six) had an equal chance of showing each side or number, what statistical test should be applied?
(Short Answer)
4.8/5 (35)
To verify that a frequency distribution for sample data is normally distributed, the expected frequencies are computed using probabilities from a _____________ distribution.
(Short Answer)
4.9/5 (35)
Which of the following can be used to test the hypothesis that two nominal variables are related?
(Multiple Choice)
4.8/5 (43)
To test the null hypothesis that a set of sample data is normally distributed, we compare an expected normal distribution of the data to an observed distribution of the data.
(True/False)
4.8/5 (34)
The computed value of chi-square statistic is always positive because the numerator is the difference between the observed frequencies and the expected frequencies _______________.
(Short Answer)
4.9/5 (37)
A F-test is useful for testing the null hypothesis that a set of sample data is normally distributed.
(True/False)
4.9/5 (42)
Three new colors have been proposed for the Jeep Grand Cherokee vehicle. They are silvered-blue, almond, and willow green. The null hypothesis for a goodness-of-fit test would be
(Multiple Choice)
4.9/5 (42)
A recent study of the relationship between social activity and education showed the following results. 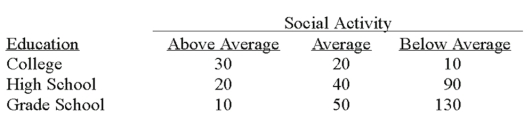 The appropriate test statistic for the analysis is a:
(Multiple Choice)
4.9/5 (41)
We are interested in knowing if the following frequency distribution is normally distributed. The mean and standard deviation of the data is 600 and 160. 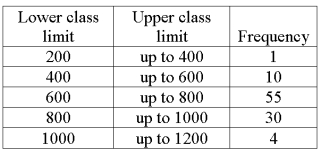 If the distribution was normally distributed, what is the probability that an observation would be a member of the "800 up to 1000" class?
(Short Answer)
4.9/5 (31)
A recent study of the relationship between social activity and education showed the following results. 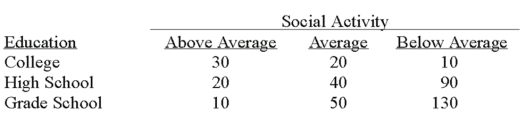 The appropriate test to analyze the relationship between social activity and education is:
(Multiple Choice)
4.8/5 (41)
We are interested in knowing if the following frequency distribution is normally distributed. The mean and standard deviation of the data is 600 and 160.  If the distribution was normally distributed, what is the probability that an observation would be a member of the "400 up to 600" class?
(Short Answer)
4.7/5 (39)
The shape of the chi-square distribution changes for each number of degrees of freedom.
(True/False)
4.9/5 (26)
We are interested in knowing if the following frequency distribution is normally distributed. The mean and standard deviation of the data is 600 and 160. 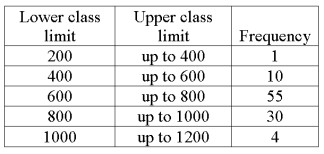 If the distribution was normally distributed, what is the probability that an observation would be a member of the "800 up to 1000" class?
(Short Answer)
5.0/5 (46)
Recently, students in a marketing research class were interested in the driving behavior of students. Specifically, the marketing students were interested if exceeding the speed limit was related to social activity. They collected the following responses from 100 randomly selected students: 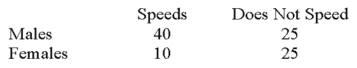 What is the value of the test statistic?
(Multiple Choice)
4.9/5 (35)
We are interested in knowing if the following frequency distribution is normally distributed. The mean and standard deviation of the data is 600 and 160. 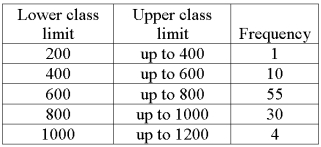 To test the hypothesis that the frequency distribution is normally distributed, what is the degrees of freedom for the chi-square statistic?
(Short Answer)
4.9/5 (41)
A survey of the opinions of property owners about a street widening project was taken to determine whether the property owners' opinions were related to their property's distance (front-footage) from the street. A randomly selected sample of 100 property owners was contacted and the results are shown below. 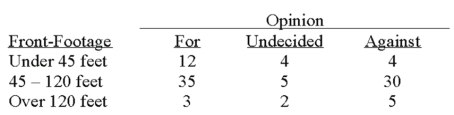 What is your decision regarding the null hypothesis at the 5% level of significance?
(Short Answer)
4.8/5 (34)
As the degrees of freedom increase, the shape of a chi-square distribution approaches a ______________________ distribution.
(Short Answer)
4.8/5 (39)
Filters
- Essay(0)
- Multiple Choice(0)
- Short Answer(0)
- True False(0)
- Matching(0)