Exam 17: Nonparametric Methods: Goodness-Of-Fit Tests
Exam 1: What Is Statistics79 Questions
Exam 2: Describing Data: Frequency Tables, Frequency Distributions, and Graphic Presentation129 Questions
Exam 3: Describing Data: Numerical Measures132 Questions
Exam 4: Describing Data: Displaying and Exploring Data108 Questions
Exam 5: A Survey of Probability Concepts130 Questions
Exam 6: Discrete Probability Distributions128 Questions
Exam 7: Continuous Probability Distributions131 Questions
Exam 8: Sampling Methods and the Central Limit Theorem115 Questions
Exam 9: Estimation and Confidence Intervals129 Questions
Exam 10: One-Sample Tests of Hypothesis134 Questions
Exam 11: Two-Sample Tests of Hypothesis130 Questions
Exam 12: Analysis of Variance128 Questions
Exam 13: Correlation and Linear Regression130 Questions
Exam 14: Multiple Regression Analysis129 Questions
Exam 15: Index Numbers129 Questions
Exam 16: Time Series and Forecasting129 Questions
Exam 17: Nonparametric Methods: Goodness-Of-Fit Tests129 Questions
Exam 18: Nonparametric Methods: Analysis of Ranked Data129 Questions
Exam 19: Statistical Process Control and Quality Management129 Questions
Exam 20: An Introduction to Decision Theory115 Questions
Select questions type
A survey of the opinions of property owners about a street widening project was taken to determine whether the resulting opinion was related to the distance from the street. A randomly selected sample of 100 property owners was contacted and the results are shown below. 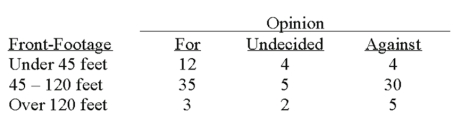 What is the critical value at the 5% level of significance?
(Multiple Choice)
4.8/5  (37)
(37)
To determine if a set of ungrouped, raw data is normally distributed, we can use
(Multiple Choice)
4.8/5 (40)
Using a graphical method to determine if a set of ungrouped, raw data is normally distributed, the data would be normally distributed if
(Multiple Choice)
4.8/5 (36)
A personnel manager is concerned about absenteeism. She decides to sample the records to determine if absenteeism is distributed evenly throughout the six-day workweek. The null hypothesis to be tested is: Absenteeism is distributed evenly throughout the week. The 0.01 level is to be used. The sample results are: 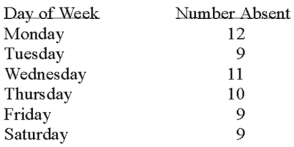 What is the calculated value of chi-square?
(Multiple Choice)
4.8/5 (34)
Six people have declared their intentions to run for a seat on the school board in the next local election. A poll is conducted during the campaign among 1,020 randomly sampled voters to determine if there is any clear preference among the voters. The responses are shown below.  What is the null hypothesis?
(Short Answer)
4.9/5 (34)
A recent study of the relationship between social activity and education showed the following results. 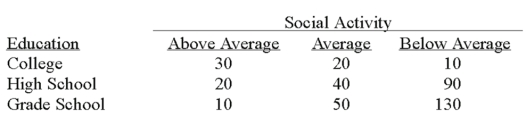 Based on the analysis, what can be concluded?
(Multiple Choice)
4.7/5 (36)
A survey of the opinions of property owners about a street widening project was taken to determine whether the resulting opinion was related to the distance from the street. A randomly selected sample of 100 property owners was contacted and the results are shown below. 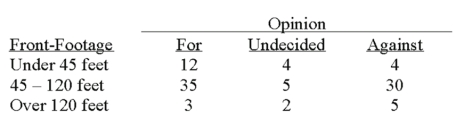 What is the expected frequency for people against the project and who have over 120 feet of property foot-frontage?
(Multiple Choice)
4.7/5 (24)
Recently, students in a marketing research class were interested in the driving behavior of students. Specifically, the marketing students were interested if exceeding the speed limit was related to social activity. They collected the following responses from 100 randomly selected students: 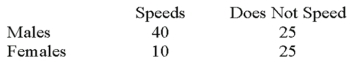 The null hypothesis for the analysis is:
(Multiple Choice)
4.8/5 (31)
A survey of the opinions of property owners about a street widening project was taken to determine whether the resulting opinion was related to the distance from the street. A randomly selected sample of 100 property owners was contacted and the results are shown below. 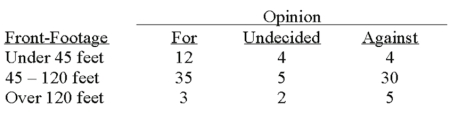 How many degrees of freedom are there?
(Multiple Choice)
4.9/5 (38)
To analyze data cross-classified in a contingency table, how are the degrees of freedom computed?
(Multiple Choice)
4.8/5 (41)
To test a hypothesis to verify that a frequency distribution for sample data is normally distributed, the expected frequencies are _______________ distributed.
(Short Answer)
4.7/5 (36)
The computed chi-square value is positive because the difference between the observed and expected frequencies is
(Multiple Choice)
4.8/5 (39)
The following table classifies an individual in two ways-by gender and by college attended. 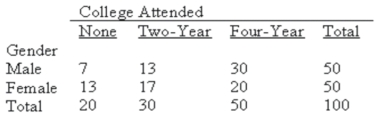 What is this two-way classification called?
(Multiple Choice)
4.8/5 (28)
A survey of the opinions of property owners about a street widening project was taken to determine whether the resulting opinion was related to the distance from the street. A randomly selected sample of 100 property owners was contacted and the results are shown below. 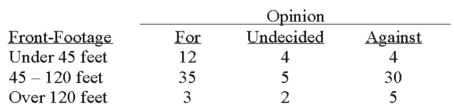 What is the critical value at the 10% level of significance?
(Multiple Choice)
4.8/5 (32)
A recent study of the relationship between social activity and education showed the following results. 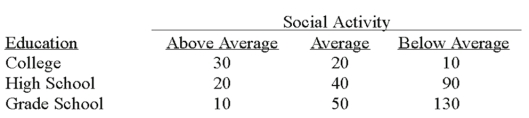 Using 0.05 as the significance level, what is the critical value for the test statistic?
(Multiple Choice)
4.8/5 (28)
What is our decision for a goodness-of-fit test with a computed value of chi-square of 1.273 and a critical value of 13.388?
(Multiple Choice)
4.8/5 (41)
For a goodness-of-fit test, the following are possible null and alternate hypotheses:
H0: Sales are uniformly distributed among the five locations.
H1: Sales are not uniformly distributed among the five locations.
(True/False)
4.7/5 (40)
The educational level and the social activity of a sample of executives follow. 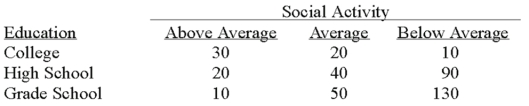 What does the expected frequency for the "above average" social activity and "high school" education equal?
(Multiple Choice)
5.0/5 (33)
Two chi-square distributions were plotted on the same chart. One distribution was for 3 degrees of freedom and the other was for 12 degrees of freedom. Which distribution would tend to approach a normal distribution?
(Multiple Choice)
4.8/5 (40)
Filters
- Essay(0)
- Multiple Choice(0)
- Short Answer(0)
- True False(0)
- Matching(0)