Exam 17: Nonparametric Methods: Goodness-Of-Fit Tests
Exam 1: What Is Statistics79 Questions
Exam 2: Describing Data: Frequency Tables, Frequency Distributions, and Graphic Presentation129 Questions
Exam 3: Describing Data: Numerical Measures132 Questions
Exam 4: Describing Data: Displaying and Exploring Data108 Questions
Exam 5: A Survey of Probability Concepts130 Questions
Exam 6: Discrete Probability Distributions128 Questions
Exam 7: Continuous Probability Distributions131 Questions
Exam 8: Sampling Methods and the Central Limit Theorem115 Questions
Exam 9: Estimation and Confidence Intervals129 Questions
Exam 10: One-Sample Tests of Hypothesis134 Questions
Exam 11: Two-Sample Tests of Hypothesis130 Questions
Exam 12: Analysis of Variance128 Questions
Exam 13: Correlation and Linear Regression130 Questions
Exam 14: Multiple Regression Analysis129 Questions
Exam 15: Index Numbers129 Questions
Exam 16: Time Series and Forecasting129 Questions
Exam 17: Nonparametric Methods: Goodness-Of-Fit Tests129 Questions
Exam 18: Nonparametric Methods: Analysis of Ranked Data129 Questions
Exam 19: Statistical Process Control and Quality Management129 Questions
Exam 20: An Introduction to Decision Theory115 Questions
Select questions type
A grouped frequency distribution has a mean of 100 and a standard deviation of 20. The class limits for one class are 50 up to 60. What are the standard normal z-statistics for the class limits?
(Multiple Choice)
4.9/5  (24)
(24)
Six people have declared their intentions to run for a trustee seat in the next local election. A political poll is conducted during the campaign among 1,020 randomly sampled voters to determine if there is any clear preference among the voters. The responses are shown below.  What is the expected frequency for each candidate?
(Short Answer)
4.7/5 (34)
Which of the following assumptions is necessary to apply a goodness-of-fit test?
(Multiple Choice)
5.0/5 (41)
A grouped frequency distribution has a mean of 200 and a standard deviation of 20. The class limits for one class are 220 up to 240. Based on the normal distribution, what is the probability that an observation would be in this class?
(Multiple Choice)
4.9/5 (40)
Six people have declared their intentions to run for a seat on the school board in the next local election. A poll is conducted during the campaign among 1,020 randomly sampled voters to determine if there is any clear preference among the voters. The responses are shown below.  At the 1% level of significance, what is your decision regarding the null hypothesis?
(Short Answer)
5.0/5 (32)
To determine if a set of ungrouped, raw data is normally distributed, the cumulative relative frequency distribution of the raw data is compared to a
(Multiple Choice)
4.8/5 (28)
A question has these possible choices-excellent, very good, good, fair and unsatisfactory. How many degrees of freedom are there using the goodness-of-fit test to the sample results?
(Multiple Choice)
4.9/5 (41)
We are interested in knowing if the following frequency distribution is normally distributed. The mean and standard deviation of the data is 600 and 160. 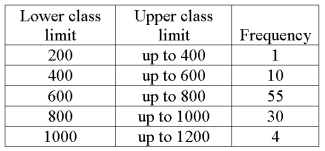 What are the standard normal z-statistic class limits for the "400 up to 600" class?
(Short Answer)
4.8/5 (31)
A survey of the opinions of property owners about a street widening project was taken to determine whether the property owners' opinions were related to their property's distance (front-footage) from the street. A randomly selected sample of 100 property owners was contacted and the results are shown below. 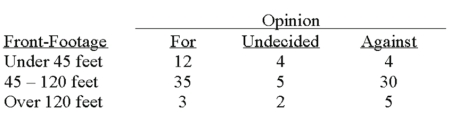 What is the alternative hypothesis? ________________________________
(Essay)
4.8/5 (40)
What is the critical value at the 0.05 level of significance for a goodness-of-fit test if there are six categories?
(Multiple Choice)
4.8/5 (40)
Why are the goodness-of-fit hypothesis tests comparing observed data to a normal distribution important in the field of statistics? Provide an example.
(Essay)
4.9/5 (40)
The Anderson-Darling tests a null hypothesis that the sample data are _____________ distributed.
(Short Answer)
5.0/5 (35)
Six people have declared their intentions to run for a seat on the school board in the next local election. A poll is conducted during the campaign among 1,020 randomly sampled voters to determine if there is any clear preference among the voters. The responses are shown below.  What is the alternative hypothesis?
(Essay)
5.0/5 (31)
To determine if a set of ungrouped, raw data is normally distributed, the null hypothesis is
(Multiple Choice)
4.7/5 (32)
A survey of the opinions of property owners about a street widening project was taken to determine whether the property owners' opinions were related to their property's distance (front-footage) from the street. A randomly selected sample of 100 property owners was contacted and the results are shown below. 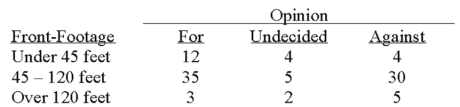 What are the degrees of freedom for testing the null hypothesis? __________
(Short Answer)
4.9/5 (39)
The chi-square test statistic used in a goodness-of-fit test has k-1 degrees of freedom.
(True/False)
4.9/5 (32)
A grouped frequency distribution has a mean of 100 and a standard deviation of 20. The class limits for one class are 50 up to 60. Based on the normal distribution, what is the probability that an observation would be in this class?
(Multiple Choice)
4.7/5 (39)
If an employee wanted to investigate the relationship between performance rating and gender, what type of analysis should be used?
(Essay)
4.8/5 (33)
Filters
- Essay(0)
- Multiple Choice(0)
- Short Answer(0)
- True False(0)
- Matching(0)