Exam 23: Output and Prices in the Short Run
Exam 1: Economic Issues and Concepts130 Questions
Exam 2: Economic Theories,Data,and Graphs140 Questions
Exam 3: Demand, Supply, and Price161 Questions
Exam 4: Elasticity160 Questions
Exam 5: Price Controls and Market Efficiency125 Questions
Exam 6: Consumer Behaviour140 Questions
Exam 7: Producers in the Short Run144 Questions
Exam 8: Producers in the Long Run141 Questions
Exam 9: Competitive Markets154 Questions
Exam 10: Monopoly, cartels, and Price Discrimination126 Questions
Exam 11: Imperfect Competition and Strategic Behaviour126 Questions
Exam 12: Economic Efficiency and Public Policy123 Questions
Exam 13: How Factor Markets Work123 Questions
Exam 14: Labour Markets and Income Inequality119 Questions
Exam 15: Interest Rates and the Capital Market107 Questions
Exam 16: Market Failures and Government Intervention123 Questions
Exam 17: The Economics of Environmental Protection133 Questions
Exam 18: Taxation and Public Expenditure121 Questions
Exam 19: What Macroeconomics Is All About116 Questions
Exam 20: The Measurement of National Income117 Questions
Exam 21: The Simplest Short-Run Macro Model156 Questions
Exam 22: Adding Government and Trade to the Simple Macro Model132 Questions
Exam 23: Output and Prices in the Short Run142 Questions
Exam 24: From the Short Run to the Long Run: The Adjustment of Factor Prices149 Questions
Exam 25: Long-Run Economic Growth129 Questions
Exam 26: Money and Banking129 Questions
Exam 27: Money, Interest Rates, and Economic Activity135 Questions
Exam 28: Monetary Policy in Canada119 Questions
Exam 29: Inflation and Disinflation122 Questions
Exam 30: Unemployment Fluctuations and the Nairu120 Questions
Exam 31: Government Debt and Deficits129 Questions
Exam 32: The Gains From International Trade127 Questions
Exam 33: Trade Policy126 Questions
Exam 34: Exchange Rates and the Balance of Payments161 Questions
Select questions type
Which of the following will cause a negative aggregate demand shock?
(Multiple Choice)
4.9/5  (34)
(34)
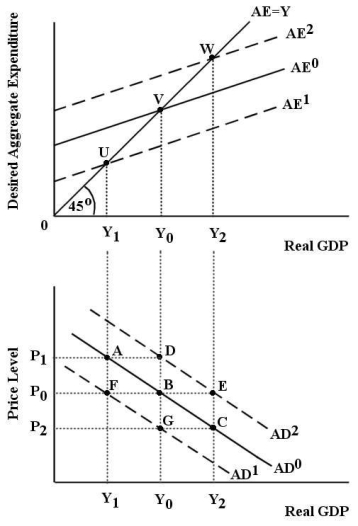 FIGURE 23-1
-Refer to Figure 23-1.Assume the economy is initially in equilibrium with desired aggregate expenditure equal to real GDP at point V.The price level is
FIGURE 23-1
-Refer to Figure 23-1.Assume the economy is initially in equilibrium with desired aggregate expenditure equal to real GDP at point V.The price level is  .Now,suppose the AE curve shifts to
  and we move to a new equilibrium level of GDP at
  and point F on
  .A possible cause of this change in equilibrium is
(Multiple Choice)
4.8/5 (38)
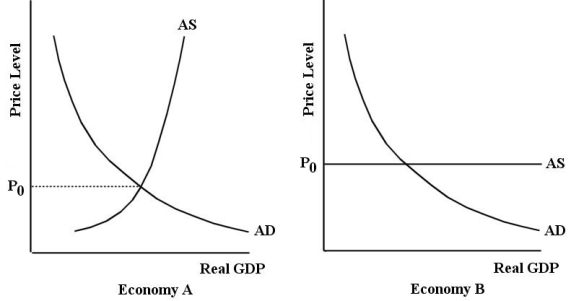 FIGURE 23-3
-Refer to Figure 23-3.Which of the following statements best describes the supply side of Economy A in its current equilibrium position?
FIGURE 23-3
-Refer to Figure 23-3.Which of the following statements best describes the supply side of Economy A in its current equilibrium position?
(Multiple Choice)
4.8/5 (28)
FIGURE 23-1
-Refer to Figure 23-1.Assume the economy is initially in equilibrium with desired aggregate expenditure equal to real GDP at point V.The price level is  .Now,suppose the AE curve shifts to
  and we move to a new equilibrium level of GDP at
  and point A on
  .A possible cause of this change in equilibrium is
(Multiple Choice)
4.9/5 (38)
Consider the following news headline: "World commodity prices rise sharply." Choose the statement below that best describes the likely macroeconomic effects in Canada.(Remember that Canada is both a producer and a consumer of commodities.)
(Multiple Choice)
4.8/5 (41)
Consider the basic AD/AS model.When wage rates rise faster than the increase in labour productivity,the
(Multiple Choice)
5.0/5 (38)
Which of the following represents a positive aggregate supply shock?
(Multiple Choice)
4.9/5 (37)
One of the reasons why the aggregate demand (AD)curve slopes downward is that
(Multiple Choice)
4.8/5 (28)
Consider the economy's aggregate supply curve.Other things being equal,unit costs will tend to increase if
(Multiple Choice)
4.8/5 (41)
The economy's aggregate supply (AS)curve shows the relationship between the price level and the total
(Multiple Choice)
4.8/5 (31)
If the economy's AS curve is very steep and there is a negative aggregate demand shock,the result will be
(Multiple Choice)
4.9/5 (37)
Other things being equal,when the domestic price level rises exogenously,
(Multiple Choice)
4.9/5 (29)
An exogenous fall in the domestic price level causes an increase in real wealth and
(Multiple Choice)
4.8/5 (33)
Aggregate demand shocks have a large effect on real GDP and a small effect on the price level
(Multiple Choice)
4.7/5 (37)
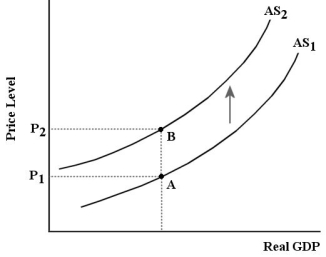 FIGURE 23-2
-Refer to Figure 23-2.Which of the following events could cause the upward shift of the AS curve?
FIGURE 23-2
-Refer to Figure 23-2.Which of the following events could cause the upward shift of the AS curve?
(Multiple Choice)
4.8/5 (35)
Other things being equal,an economy with a higher net tax rate will have a ________ marginal propensity to spend and thus a ________ AD curve compared to an economy with a lower net tax rate.
(Multiple Choice)
5.0/5 (27)
Consider the basic AD/AS model.If major labour unions succeed in increasing wages across the economy,the AS curve will shift
(Multiple Choice)
4.8/5 (34)
Consider the basic AD/AS model.If there is a decrease in the cost of non-labour inputs to production,the result will be to
(Multiple Choice)
4.9/5 (32)
In a macro model with a constant price level,an increase in government purchases will cause the AE curve to shift
(Multiple Choice)
4.7/5 (39)
Consider the basic AD/AS model.Suppose that a rising percentage of high-school graduates are illiterate,resulting in a decrease in average labour productivity.This change will
(Multiple Choice)
4.8/5 (39)
Filters
- Essay(0)
- Multiple Choice(0)
- Short Answer(0)
- True False(0)
- Matching(0)