Exam 9: Sampling Distributions
Exam 1: What Is Statistics46 Questions
Exam 2: Graphical Descriptive Techniques 194 Questions
Exam 3: Graphical Descriptive Techniques 2156 Questions
Exam 4: Numerical Descriptive Techniques275 Questions
Exam 5: Data Collection and Sampling84 Questions
Exam 6: Probability240 Questions
Exam 7: Random Variables and Discrete Probability Distributions283 Questions
Exam 8: Continuous Probability Distributions224 Questions
Exam 9: Sampling Distributions156 Questions
Exam 10: Introduction to Estimation154 Questions
Exam 11: Introduction to Hypothesis Testing189 Questions
Exam 12: Inference About a Population153 Questions
Exam 13: Inference About Comparing Two Populations170 Questions
Exam 14: Analysis of Variance157 Questions
Exam 15: Chi-Squared Tests179 Questions
Exam 16: Simple Linear Regression and Correlation304 Questions
Exam 17: Multiple Regression160 Questions
Exam 18: Model Building148 Questions
Exam 19: Nonparametric Statistics175 Questions
Exam 20: Time-Series Analytics and Forecasting225 Questions
Exam 21: Statistical Process Control140 Questions
Exam 22: Decision Analysis123 Questions
Exam 23: Conclusion47 Questions
Select questions type
A sample of size n is selected at random from an infinite population.As n increases,which of the following statements is true?
(Multiple Choice)
4.9/5  (30)
(30)
As a general rule,the normal distribution is used to approximate the sampling distribution of the sample proportion only if:
(Multiple Choice)
4.8/5 (29)
If all possible samples of size n are drawn from a normal population,the probability distribution of the sample mean  is an normal distribution.
(True/False)
4.9/5 (41)
As a general rule,the normal distribution is used to approximate the sampling distribution of the sample proportion only if the sample size n is greater than or equal to 30.
(True/False)
4.8/5 (34)
If all possible samples of size n are drawn from an infinite population with a mean of 15 and a standard deviation of 5,then the standard error of the sample mean equals 1.0 for samples of size:
(Multiple Choice)
4.8/5 (26)
If the sample size increases,the standard error of the mean also increases.
(True/False)
4.7/5 (40)
The expected value of the sampling distribution of the sample mean  equals the population mean μ :
(Multiple Choice)
5.0/5 (25)
The standard error of the sample proportion gets larger as:
(Multiple Choice)
4.9/5 (39)
The expected value of the sampling distribution of 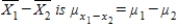 where μi is the mean of population i (i = 1,2).
(True/False)
4.8/5 (41)
To find the binomial probability P(X ≤ 4)we calculate the area under the normal curve to the ____________________ (left/right)of the number ____________________.
(Short Answer)
4.9/5 (32)
As n gets ____________________,the shape of the sampling distribution of  becomes increasingly bell shaped.
(Short Answer)
4.8/5 (40)
As a general rule in computing the standard error of the sample mean,the finite population correction factor is used only if the:
(Multiple Choice)
4.9/5 (38)
When a great many simple random samples of size n are drawn from a population that is normally distributed,the sampling distribution of the sample mean is normal regardless of the sample size n.
(True/False)
4.9/5 (29)
If two random samples of sizes n1 and n2 are selected independently from two non-normally distributed populations,then the sampling distribution of the sample mean difference,  ,is
,is
(Multiple Choice)
4.9/5 (33)
Which of the following statements about the sampling distribution of  is NOT true?
(Multiple Choice)
5.0/5 (38)
Random samples of size 49 are taken from an infinite population whose mean is 300 and standard deviation is 21.The mean and standard error of the sample mean,respectively,are:
(Multiple Choice)
4.9/5 (39)
Given a binomial random variable with n = 15 and p = .40,find the exact probabilities of the following events and their normal approximations.
a.X = 6
b.X ≥ 9
c.X ≤ 10
(Essay)
4.9/5 (32)
Under certain conditions where n is large enough,you can approximate the ____________________ distribution using the ____________________ distribution.
(Short Answer)
4.8/5 (39)
Number of Fish Tanks
The following data give the number of fish tanks owned for a population of 4 families. 
-{Number of Fish Tanks Narrative} A sample of size 2 is drawn at random from the population.Use the formulas
-{Number of Fish Tanks Narrative} A sample of size 2 is drawn at random from the population.Use the formulas  and
and 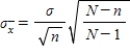 to calculate the mean and the standard deviation of the sampling distribution of the sample means.
(Essay)
4.8/5 (34)
If the population is normal,then  is normally distributed for __________________ values of n.
(Short Answer)
4.8/5 (28)
Filters
- Essay(0)
- Multiple Choice(0)
- Short Answer(0)
- True False(0)
- Matching(0)