Exam 13: Inference About Comparing Two Populations
Exam 1: What Is Statistics46 Questions
Exam 2: Graphical Descriptive Techniques 194 Questions
Exam 3: Graphical Descriptive Techniques 2156 Questions
Exam 4: Numerical Descriptive Techniques275 Questions
Exam 5: Data Collection and Sampling84 Questions
Exam 6: Probability240 Questions
Exam 7: Random Variables and Discrete Probability Distributions283 Questions
Exam 8: Continuous Probability Distributions224 Questions
Exam 9: Sampling Distributions156 Questions
Exam 10: Introduction to Estimation154 Questions
Exam 11: Introduction to Hypothesis Testing189 Questions
Exam 12: Inference About a Population153 Questions
Exam 13: Inference About Comparing Two Populations170 Questions
Exam 14: Analysis of Variance157 Questions
Exam 15: Chi-Squared Tests179 Questions
Exam 16: Simple Linear Regression and Correlation304 Questions
Exam 17: Multiple Regression160 Questions
Exam 18: Model Building148 Questions
Exam 19: Nonparametric Statistics175 Questions
Exam 20: Time-Series Analytics and Forecasting225 Questions
Exam 21: Statistical Process Control140 Questions
Exam 22: Decision Analysis123 Questions
Exam 23: Conclusion47 Questions
Select questions type
When the population variances are unequal,we estimate each population variance with its sample variance.Hence,the unequal-variances test statistic of  is approximately Student t-distributed with n1 + n2 − 2 degrees of freedom.
Free
(True/False)
4.8/5  (32)
(32)
Correct Answer: Verified
True
When the necessary conditions are met,a two-tail test is being conducted at α = .05 to test  .The two sample variances are
  and
and  ,and the sample sizes are n1 = 25 and n2 = 25.The calculated value of the test statistic will be F = 2.
Free
(True/False)
4.9/5 (36)
Correct Answer:Verified
False
Undergraduates' Test Scores
35 undergraduate students who completed two years of college were asked to take a basic mathematics test.The mean and standard deviation of their scores were 75.1 and 12.8,respectively.In a random sample of 50 students who only completed high school,the mean and standard deviation of the test scores were 72.1 and 14.6,respectively.
-{Undergraduates' Test Scores Narrative} Explain how to use the interval estimate to test the hypotheses.
Free
(Essay)
4.9/5 (33)
Correct Answer:Verified
Since the hypothesized value 0 is included in the 90% confidence interval,we fail to reject the null hypothesis at α = .10.
Starting Salary
In testing the hypotheses  two random samples from two populations of college of business graduates majoring in global marketing and international business produced the following statistics regarding their starting salaries (in $1000s):
  (Assume the salaries have normal distributions.)
-{Starting Salary Narrative} Explain how to use the 95% confidence interval to test the hypotheses at α = .05.
(Assume the salaries have normal distributions.)
-{Starting Salary Narrative} Explain how to use the 95% confidence interval to test the hypotheses at α = .05.
(Essay)
4.9/5 (31)
Both the equal-variances and unequal variances test statistic and confidence interval estimator of  require that the two populations be normally distributed.
(True/False)
4.7/5 (39)
In testing for the differences between the means of two independent populations where the variances in each population are unknown but assumed equal,the degrees of freedom is:
(Multiple Choice)
4.7/5 (21)
A councilwoman regularly polls her constituency to gauge her level of support among voters.This month,652 out of 1158 voters support her.Five months ago,412 out of 982 voters supported her.With a 5% significance level,can she infer that support has increased by at least 10 percentage points?
(Essay)
4.8/5 (32)
Headache Medicine
A researcher wants to see if/how men and women differ in their reaction to a headache medicine with respect to drowsiness.In testing the hypotheses  .the following statistics were obtained: n1 = 400,x1 = 208,n2 = 250,and x2 = 115,where x1 and x2 represent the number of patients in the two samples (men vs.women)who reported to have drowsiness as a result of taking headache medicine.
-{Headache Medicine Narrative} Estimate with 90% confidence the difference between the two population proportions.
.the following statistics were obtained: n1 = 400,x1 = 208,n2 = 250,and x2 = 115,where x1 and x2 represent the number of patients in the two samples (men vs.women)who reported to have drowsiness as a result of taking headache medicine.
-{Headache Medicine Narrative} Estimate with 90% confidence the difference between the two population proportions.
(Essay)
4.8/5 (35)
The difference in two sample proportions is an unbiased consistent estimator of the difference in their respective population proportions.
(True/False)
4.7/5 (41)
If we are testing for the difference between the means of two independent populations with equal variances,samples of n1 = 15 and n2 = 15 are taken,then the number of degrees of freedom is equal to
(Multiple Choice)
4.9/5 (33)
To estimate the ratio of the population variances you use the ____________________ of the ____________________ variances.
(Short Answer)
4.9/5 (32)
Clothing Expenditures
A marketing consultant was in the process of studying the perceptions of married couples concerning their monthly clothing expenditures.He believed that the husband's perception would be higher than the wife's.To judge his belief,he takes a random sample of ten married couples and asks each spouse to estimate the family clothing expenditure (in dollars)during the previous month.The data are shown below. 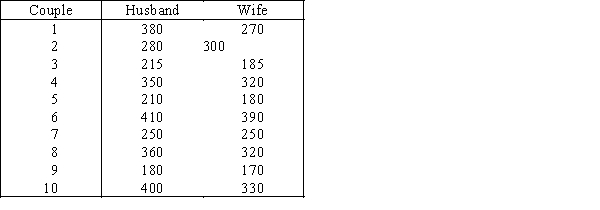
-{Clothing Expenditures Narrative} Estimate with 95% confidence the population mean difference.
-{Clothing Expenditures Narrative} Estimate with 95% confidence the population mean difference.
(Essay)
4.8/5 (28)
The statistical distribution used for testing the difference between two population variances is the
(Multiple Choice)
4.8/5 (30)
Worker Safety
An OSHA agent wanted to determine if efforts to promote safety have been successful.By checking the records of 250 workers,he found that 30 of them suffered either minor or major injuries that year.A random sample of 400 workers last year revealed that 80 suffered some form of injury.
-{Worker Safety Narrative} What is the p-value of the test? Explain how to use it for testing the hypotheses.
(Essay)
4.9/5 (41)
The number of degrees of freedom associated with the t-test,when the data are gathered from a matched pairs experiment with 10 pairs,is:
(Multiple Choice)
4.9/5 (32)
We compare two population variances by examining their ____________________.
(Short Answer)
4.7/5 (36)
Undergraduates' Test Scores
35 undergraduate students who completed two years of college were asked to take a basic mathematics test.The mean and standard deviation of their scores were 75.1 and 12.8,respectively.In a random sample of 50 students who only completed high school,the mean and standard deviation of the test scores were 72.1 and 14.6,respectively.
-{Undergraduates' Test Scores Narrative} Estimate with 90% confidence the difference in mean scores between the two groups of students.
(Essay)
4.9/5 (38)
Promotional Campaigns
The general manager of a chain of fast food chicken restaurants wants to determine how effective their promotional campaigns are.In these campaigns "20% off" coupons are widely distributed.These coupons are only valid for one week.To examine their effectiveness,the executive records the daily gross sales (in $1,000s)in one restaurant during the campaign and during the week after the campaign ends.The data is shown below. 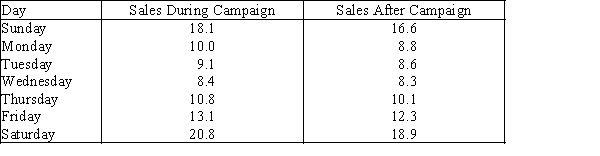
-{Promotional Campaigns Narrative} Estimate with 95% confidence the mean difference and interpret.
-{Promotional Campaigns Narrative} Estimate with 95% confidence the mean difference and interpret.
(Essay)
4.7/5 (29)
Pooling is made possible by hypothesizing (under the null hypothesis)that p1 = p2.
(True/False)
4.7/5 (27)
The expected value of the difference between two sample proportions is the ____________________ of/between their corresponding population proportions.
(Short Answer)
4.8/5 (37)
Filters
- Essay(0)
- Multiple Choice(0)
- Short Answer(0)
- True False(0)
- Matching(0)