Exam 21: Statistical Process Control
Exam 1: What Is Statistics46 Questions
Exam 2: Graphical Descriptive Techniques 194 Questions
Exam 3: Graphical Descriptive Techniques 2156 Questions
Exam 4: Numerical Descriptive Techniques275 Questions
Exam 5: Data Collection and Sampling84 Questions
Exam 6: Probability240 Questions
Exam 7: Random Variables and Discrete Probability Distributions283 Questions
Exam 8: Continuous Probability Distributions224 Questions
Exam 9: Sampling Distributions156 Questions
Exam 10: Introduction to Estimation154 Questions
Exam 11: Introduction to Hypothesis Testing189 Questions
Exam 12: Inference About a Population153 Questions
Exam 13: Inference About Comparing Two Populations170 Questions
Exam 14: Analysis of Variance157 Questions
Exam 15: Chi-Squared Tests179 Questions
Exam 16: Simple Linear Regression and Correlation304 Questions
Exam 17: Multiple Regression160 Questions
Exam 18: Model Building148 Questions
Exam 19: Nonparametric Statistics175 Questions
Exam 20: Time-Series Analytics and Forecasting225 Questions
Exam 21: Statistical Process Control140 Questions
Exam 22: Decision Analysis123 Questions
Exam 23: Conclusion47 Questions
Select questions type
The mean of the sample means and the pooled standard deviation of 40 samples of size 5 taken from a production process under control are found to be 400 and 15,respectively.The lower control limit for the  chart is:
Free
(Multiple Choice)
4.8/5  (36)
(36)
Correct Answer: Verified
C
____________________ variation is caused by specific events or factors that are frequently temporary.
Free
(Short Answer)
4.8/5 (29)
Correct Answer:Verified
Assignable
Special
Control charts that are used to monitor a process whose results are categorized as either defective or non-defective are called p charts.
Free
(True/False)
5.0/5 (39)
Correct Answer:Verified
True
The  chart is employed to determine whether the process distribution means have changed.To determine whether the process distribution standard deviation has changed,we use the S (which stands for standard deviation)chart.
(True/False)
4.9/5 (34)
What is the average run length (ARL)until an  control chart signals a false alarm if the control limits are set at ±2.5 standard errors from the centerline?
(Essay)
4.9/5 (34)
40 Samples Manufacturing
The mean of the sample means and the pooled standard deviation of 40 samples of size 5 taken from a production process under control are  ,and S = 11.5,respectively.
-{40 Samples Manufacturing Narrative} Compute the zone boundaries for the
,and S = 11.5,respectively.
-{40 Samples Manufacturing Narrative} Compute the zone boundaries for the  chart.
(Essay)
4.8/5 (37)
30 Samples Production Thirty samples of size 4 were drawn from a production process.The data are shown below. 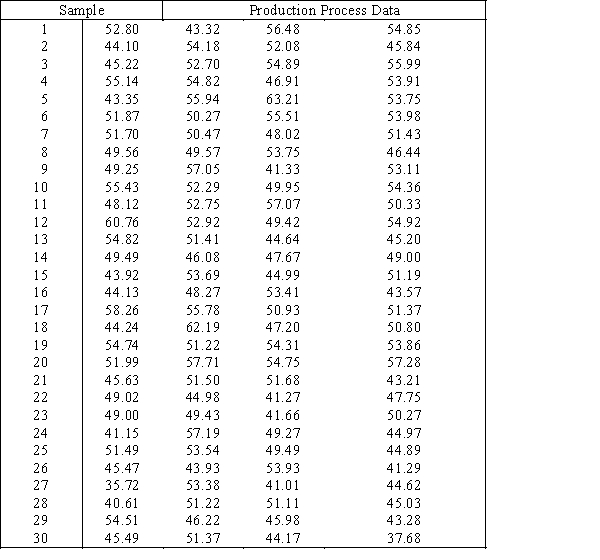
-{30 Samples Production Narrative} Looking at the
-{30 Samples Production Narrative} Looking at the  and S charts developed in a previous question,can you infer that the process is under control? If so,explain why.If not,explain what the problems are.
(Essay)
4.8/5 (28)
Diaper Delivery
Wrap-M-Up,a Ft.Lauderdale diaper Service,has 10 delivery men who each deliver diapers to 50 customers every day.Wrap-M-Up decides to record the proportion of diapers delivered on time for a 10-day period and construct a p chart to see whether the proportion is too erratic.The data are shown below: 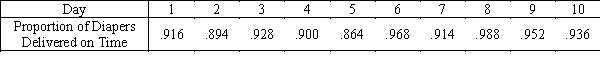
-{Diaper Delivery Narrative} Find the numerical value of the center line for the p chart.
-{Diaper Delivery Narrative} Find the numerical value of the center line for the p chart.
(Short Answer)
4.8/5 (27)
If the average run length of a process is 385,then the  control chart will wrongly conclude that the process is out of control once every 385 samples on average.
(True/False)
4.8/5 (36)
Assume that the control limits of an  chart are defined as 3 standard errors above and below the centerline.Calculate the probability that a sample mean falls outside the control limits when the process is in fact under control.
(Essay)
4.8/5 (33)
In statistical process control,a Type II error is usually expensive since it means stopping production to repair the cause of the variation.
(True/False)
4.8/5 (29)
If a machine part is slowly losing its ability to work,causing the standard deviation of the process to increase,this is an example of assignable variation called a trend.
(True/False)
4.9/5 (38)
The mean of the sample means and the pooled standard deviation of 40 samples of size 9 taken from a production process under control are  ,and S = 12,respectively.The lower control limit and the upper control limit of the 3-sigma
  chart are 408 and 432,respectively.
(True/False)
4.8/5 (40)
30 Samples Production Thirty samples of size 4 were drawn from a production process.The data are shown below.
-{30 Samples Production Narrative} Construct an S chart.
(Essay)
4.9/5 (25)
The ____________________ is the expected number of samples that must be taken on average,before the control chart indicates that the process has gone out of control.
(Short Answer)
4.8/5 (36)
30 Samples Production Thirty samples of size 4 were drawn from a production process.The data are shown below.
-{30 Samples Production Narrative} Construct an  chart.
(Essay)
4.9/5 (30)
The centerline of an  control chart is the mean of the samples being collected.
(True/False)
4.8/5 (39)
Assume that the control limits of an  chart are defined as 2.5 standard errors above and below the centerline.Calculate the probability that a sample mean falls outside the control limits when the process is in fact under control.
(Essay)
4.7/5 (33)
40 Samples Production
The mean of the sample means and the pooled standard deviation of 40 samples of size 8 taken from a production process under control are  ,and S = 14.5,respectively.
-{40 Samples Production Narrative} Calculate the centerline and control limits for the
,and S = 14.5,respectively.
-{40 Samples Production Narrative} Calculate the centerline and control limits for the  chart.
(Essay)
4.9/5 (41)
30 Samples Production Thirty samples of size 4 were drawn from a production process.The data are shown below.
-{30 Samples Production Narrative} Calculate the mean and standard deviation of each sample.
(Essay)
4.9/5 (36)
Filters
- Essay(0)
- Multiple Choice(0)
- Short Answer(0)
- True False(0)
- Matching(0)