Exam 3: Graphical Descriptive Techniques 2
Exam 1: What Is Statistics46 Questions
Exam 2: Graphical Descriptive Techniques 194 Questions
Exam 3: Graphical Descriptive Techniques 2156 Questions
Exam 4: Numerical Descriptive Techniques275 Questions
Exam 5: Data Collection and Sampling84 Questions
Exam 6: Probability240 Questions
Exam 7: Random Variables and Discrete Probability Distributions283 Questions
Exam 8: Continuous Probability Distributions224 Questions
Exam 9: Sampling Distributions156 Questions
Exam 10: Introduction to Estimation154 Questions
Exam 11: Introduction to Hypothesis Testing189 Questions
Exam 12: Inference About a Population153 Questions
Exam 13: Inference About Comparing Two Populations170 Questions
Exam 14: Analysis of Variance157 Questions
Exam 15: Chi-Squared Tests179 Questions
Exam 16: Simple Linear Regression and Correlation304 Questions
Exam 17: Multiple Regression160 Questions
Exam 18: Model Building148 Questions
Exam 19: Nonparametric Statistics175 Questions
Exam 20: Time-Series Analytics and Forecasting225 Questions
Exam 21: Statistical Process Control140 Questions
Exam 22: Decision Analysis123 Questions
Exam 23: Conclusion47 Questions
Select questions type
The original observations cannot be determined once they are grouped into a frequency distribution.
Free
(True/False)
4.8/5  (33)
(33)
Correct Answer: Verified
True
When a distribution has more values to the left and tails off to the right,it is skewed negatively.
Free
(True/False)
4.9/5 (41)
Correct Answer:Verified
False
When two variables are linearly related,and tend to move in opposite directions,we describe the nature of their association as a negative linear relationship.
Free
(True/False)
4.9/5 (32)
Correct Answer:Verified
True
A(n)____________________ is created by plotting the value of the variable on the vertical axis and the time periods on the horizontal axis.
(Short Answer)
4.8/5 (40)
If we draw a straight line through the points in a scatter diagram and most of the points fall close to the line,there must be a positive relationship between the two variables.
(True/False)
4.8/5 (26)
It is typical that when taking an exam,few students hand in their exams early; most prefer to reread their papers and hand them in near the end of the scheduled exam period.Under this scenario,a histogram of exam taking times is ____________________ skewed.
(Short Answer)
4.7/5 (31)
Observations that are measured at the same time represent what type of data?
(Multiple Choice)
4.7/5 (41)
Compare the spread of the two histograms below.Which of the following is true? 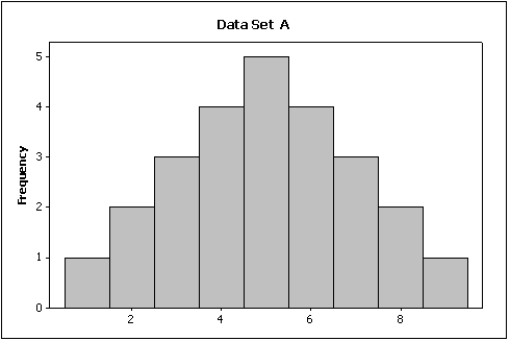
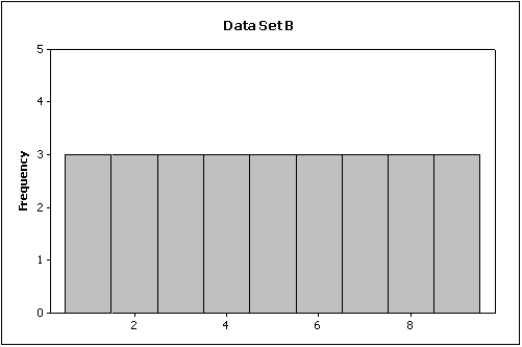
(Multiple Choice)
5.0/5 (26)
The number of class intervals in a histogram depends on the number of observations in the data set.
(True/False)
4.7/5 (36)
Insurance Company A representative from a local insurance agency selected a random sample of insured homeowners and recorded the number of claims made in the last three years,with the following results: 
-{Insurance Company Narrative} What number of claims was made by the highest proportion of homeowners?
-{Insurance Company Narrative} What number of claims was made by the highest proportion of homeowners?
(Essay)
4.8/5 (33)
A line chart that is flat shows no fluctuation in the variable being presented.
(True/False)
4.9/5 (37)
Electronics Company At a meeting of regional offices managers of a national electronics company,a survey was taken to determine the number of employees the regional managers supervise in the operation of their departments.The results of the survey are shown below. 
-{Electronics Company Narrative} Across all of the regional offices,how many total employees were supervised by those surveyed?
-{Electronics Company Narrative} Across all of the regional offices,how many total employees were supervised by those surveyed?
(Essay)
5.0/5 (37)
Which of the following describes a positive linear relationship between X and Y?
(Multiple Choice)
4.9/5 (43)
The number of observations within each class may be found in a frequency distribution.
(True/False)
4.8/5 (28)
Electronics Company At a meeting of regional offices managers of a national electronics company,a survey was taken to determine the number of employees the regional managers supervise in the operation of their departments.The results of the survey are shown below.
-{Electronics Company Narrative} What is the cumulative relative frequency corresponding to 4 employees?
(Essay)
4.8/5 (38)
 Admission to ER The following bar chart shows the type of aspirin (if any)given to 100 cardiac patients within 15 minutes of their admission to the emergency room.
 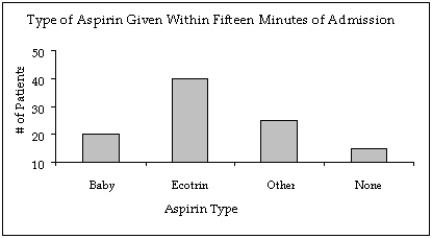 -{Admission to ER Narrative} Notice that the Y-axis of the bar chart does not start at a frequency of zero.Create a new bar chart of the displayed data that accurately displays the frequency for each aspirin type.
(Essay)
4.9/5 (30)
Home Care Data are collected on the number of house calls (x)made in a given week by each of 60 nurses in a certain hospital.The same data set is displayed in each of the three histograms below. 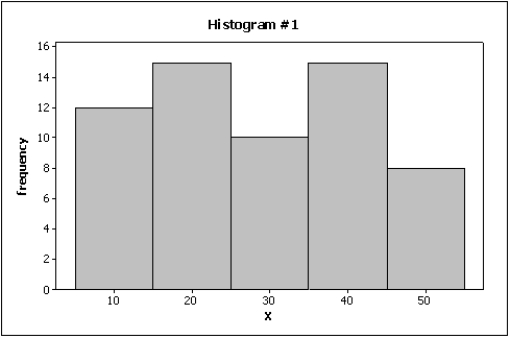
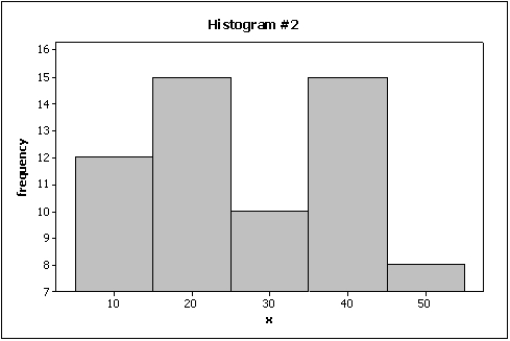
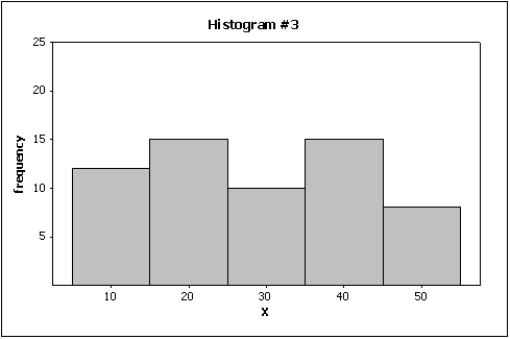
-{Home Care Narrative}Which graph do you think is the most appropriate display? Justify your answer.
-{Home Care Narrative}Which graph do you think is the most appropriate display? Justify your answer.
(Essay)
4.9/5 (40)
Insurance Company A representative from a local insurance agency selected a random sample of insured homeowners and recorded the number of claims made in the last three years,with the following results:
-{Insurance Company Narrative} How many homeowners are represented in the sample?
(Short Answer)
4.8/5 (32)
Filters
- Essay(0)
- Multiple Choice(0)
- Short Answer(0)
- True False(0)
- Matching(0)