Exam 2: Graphical Descriptive Techniques 1
Exam 1: What Is Statistics46 Questions
Exam 2: Graphical Descriptive Techniques 194 Questions
Exam 3: Graphical Descriptive Techniques 2156 Questions
Exam 4: Numerical Descriptive Techniques275 Questions
Exam 5: Data Collection and Sampling84 Questions
Exam 6: Probability240 Questions
Exam 7: Random Variables and Discrete Probability Distributions283 Questions
Exam 8: Continuous Probability Distributions224 Questions
Exam 9: Sampling Distributions156 Questions
Exam 10: Introduction to Estimation154 Questions
Exam 11: Introduction to Hypothesis Testing189 Questions
Exam 12: Inference About a Population153 Questions
Exam 13: Inference About Comparing Two Populations170 Questions
Exam 14: Analysis of Variance157 Questions
Exam 15: Chi-Squared Tests179 Questions
Exam 16: Simple Linear Regression and Correlation304 Questions
Exam 17: Multiple Regression160 Questions
Exam 18: Model Building148 Questions
Exam 19: Nonparametric Statistics175 Questions
Exam 20: Time-Series Analytics and Forecasting225 Questions
Exam 21: Statistical Process Control140 Questions
Exam 22: Decision Analysis123 Questions
Exam 23: Conclusion47 Questions
Select questions type
When studying the responses to two nominal questions,we should develop a
Free
(Multiple Choice)
4.9/5  (30)
(30)
Correct Answer: Verified
A
For which type of data are the values arbitrary numbers?
Free
(Multiple Choice)
4.7/5 (35)
Correct Answer:Verified
B
Suppose you measure the number of minutes it takes an employee to complete a task,where the maximum allowed time is 5 minutes,and each time is rounded to the nearest minute.Data from 130 employees is summarized below.How long did it take most employees to complete the task? 
Free
(Multiple Choice)
4.7/5 (30)
Correct Answer:Verified
B
Which of the following situations is best suited for a pie chart?
(Multiple Choice)
4.8/5 (36)
In the following cross-classification table,gender and car ownership are related. 
(True/False)
4.8/5 (34)
Two types of graphs that organize nominal data are ____________________ and ____________________.
(Short Answer)
4.9/5 (35)
A cross-classification table is used to describe the relationship between two ____________________ variables.
(Short Answer)
4.8/5 (32)
In a pie chart,each slice is proportional to the ____________________ of individuals in that category.
(Short Answer)
4.8/5 (34)
For what type of data are frequencies the only calculations that can be done?
(Multiple Choice)
4.8/5 (38)
{Business School Graduates Narrative} If you were only given the frequency bar chart below,would you able to reconstruct the original observations in the data set? 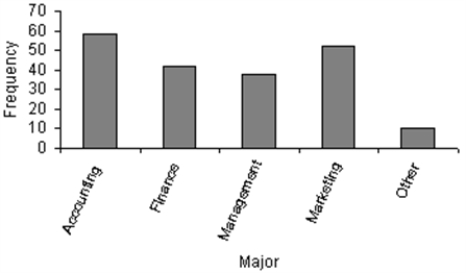
(Essay)
4.9/5 (28)
A survey of 100 adults was conducted to see if gender is related to pet ownership.The results are summarized in the bar chart below.Which of the following statements describes the relationship? 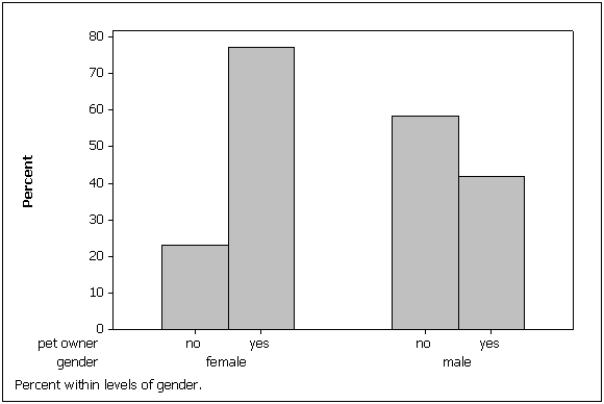
(Multiple Choice)
4.8/5 (38)
A category in a pie chart that contains 50% of the observations is represented by a slice of the pie that is equal to ____________________ degrees.
(Short Answer)
4.9/5 (37)
Data that contains information on a single variable is called ____________________ data.
(Short Answer)
4.8/5 (35)
The final grade received in a Literature course (A,B,C,D,or F)is an example of a(n)____________________ variable.
(Short Answer)
4.9/5 (30)
One of the advantages of a pie chart is that it clearly shows that the total percentages of all the categories add to 100%.
(True/False)
4.9/5 (34)
Data that contains information on two variables is called ____________________ data.
(Short Answer)
4.8/5 (36)
Using Excel,draw two bar charts that compare type of customer for males vs.females.Are gender and promotional customers related? 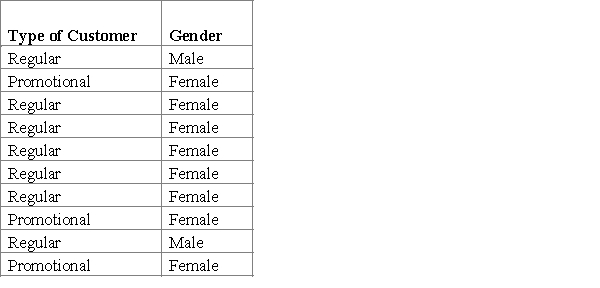
(Essay)
4.8/5 (41)
Interval data,such as heights,weights,incomes,and distances,are also referred to as quantitative or numerical data.
(True/False)
4.7/5 (36)
Filters
- Essay(0)
- Multiple Choice(0)
- Short Answer(0)
- True False(0)
- Matching(0)