Exam 12: Inference About a Population
Exam 1: What Is Statistics46 Questions
Exam 2: Graphical Descriptive Techniques 194 Questions
Exam 3: Graphical Descriptive Techniques 2156 Questions
Exam 4: Numerical Descriptive Techniques275 Questions
Exam 5: Data Collection and Sampling84 Questions
Exam 6: Probability240 Questions
Exam 7: Random Variables and Discrete Probability Distributions283 Questions
Exam 8: Continuous Probability Distributions224 Questions
Exam 9: Sampling Distributions156 Questions
Exam 10: Introduction to Estimation154 Questions
Exam 11: Introduction to Hypothesis Testing189 Questions
Exam 12: Inference About a Population153 Questions
Exam 13: Inference About Comparing Two Populations170 Questions
Exam 14: Analysis of Variance157 Questions
Exam 15: Chi-Squared Tests179 Questions
Exam 16: Simple Linear Regression and Correlation304 Questions
Exam 17: Multiple Regression160 Questions
Exam 18: Model Building148 Questions
Exam 19: Nonparametric Statistics175 Questions
Exam 20: Time-Series Analytics and Forecasting225 Questions
Exam 21: Statistical Process Control140 Questions
Exam 22: Decision Analysis123 Questions
Exam 23: Conclusion47 Questions
Select questions type
When a population is small,it is necessary to include the ____________________ factor in our hypothesis tests and confidence interval estimators for p.
(Short Answer)
4.8/5  (35)
(35)
The test statistic for p is approximately normal when ____________________ and ____________________ are both greater than 5.
(Short Answer)
4.8/5 (42)
The 95% confidence interval would indicate that,for this shipment,the proportion of defective fuses is between 0 and 0.28.
(True/False)
4.7/5 (35)
If we are testing for an improvement in the consistency of an operation or the manufacturing of a product,the alternative hypothesis would have a(n)____________________ sign in it.
(Essay)
5.0/5 (38)
Healthy Foods
In segmenting the frozen meal market in Spain,a food manufacturer uses health and diet consciousness as the segmentation variable.Four segments are developed and coded as follows: 1: Concerned about eating healthy foods 2: Concerned about weight 3: Concerned about health because of illness 4: Unconcerned To distinguish between groups,surveys are conducted.On the basis of a questionnaire,people are categorized as belonging to one of these groups.A recent survey asked a random sample of 1,500 Spanish adults (20 and over)to complete the survey.Out of the 1,500 people surveyed,360 indicated that they are concerned about eating healthy foods.The most recent information available reveals that there are 40,256,000 Spanish adults who are 20 and over.
-{Healthy Foods Narrative} What is the parameter we wish to estimate? Explain.
(Essay)
4.8/5 (35)
Applicants' Grades
The grades of a sample of 10 applicants,selected at random from a large population,are 71,86,75,63,92,70,81,59,80,and 90.
-{Applicants' Grades Narrative} Construct a 90% confidence interval estimate for the population standard deviation.
(Essay)
4.7/5 (44)
The formula 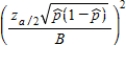 is used to find the sample size needed to estimate a population proportion.In this formula,B represents the ____________________ on the error of estimation.
(Short Answer)
4.9/5 (38)
When the population standard deviation is ____________________ and the population is normal,the test statistic for testing hypotheses about μ is the t-distribution with n − 1 degrees of freedom.
(Short Answer)
4.7/5 (38)
The t-distribution allows the calculation of confidence intervals for means for small samples when the population variance is not known,regardless of the shape of the distribution in the population.
(True/False)
4.8/5 (34)
The air pumps at service stations come equipped with a gauge to regulate the air pressure of tires.A mechanic believes that the gauges are in error by at least 3 pounds per square inch.To test his belief he takes a random example of 50 air pump gauges and determines the difference between the true pressure (as measured by an accurate measuring device)and the pressure shown on the air pump gauge.The mean and the standard deviation of the sample are  = 3.4 and s = 1.2.Can the mechanic infer that he is correct at the 5% significance level? Assume tire pressures have a normal distribution.
(Essay)
4.9/5 (36)
For a 99% confidence interval of the population mean based on a sample of n = 25 with s = 0.05,the critical value of t is:
(Multiple Choice)
4.7/5 (38)
During a natural gas shortage,a gas company randomly sampled residential gas meters in order to monitor daily gas consumption.On a particular day,a sample of 100 meters showed a sample mean of 250 cubic feet and a sample standard deviation of 50 cubic feet.Provide a 90% confidence interval estimate of the mean gas consumption for the population.
(Essay)
4.9/5 (37)
To estimate ____________________ when the population size N is small,the confidence interval estimator is 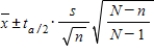 .
.
(Short Answer)
4.9/5 (37)
In market segmentation,if education is the segmentation variable of interest,then possible segments of the market include: some high school,high school graduates,some college,college or university graduates.
(True/False)
4.7/5 (30)
In selecting the sample size to estimate the population proportion p,if we have no knowledge of even the approximate values of the sample proportion  ,we:
,we:
(Multiple Choice)
4.8/5 (37)
Energy Drink Consumption
A researcher at the University of Washington medical school believes that energy drink consumption may increase heart rate.Suppose it is known that heart rate (in beats per minute)is normally distributed with an average of 70 bpm for adults.A random sample of 25 adults was selected and it was found that their average heartbeat was 73 bpm after energy drink consumption,with a standard deviation of 7 bpm.
-{Energy Drink Consumption Narrative} Test the hypotheses in the previous question at the 10% significance level to determine if we can infer that energy drink consumption increases heart rate.
(Essay)
4.8/5 (33)
When the population standard deviation is unknown and the population is ____________________,the test statistic for testing hypotheses about μ is the t-distribution with n − 1 degrees of freedom.
(Short Answer)
4.7/5 (29)
The statistic s2 is an unbiased and consistent estimator of σ2.
(True/False)
4.8/5 (36)
If the sampled population is nonnormal,the t-test of the population mean μ is still valid,provided that the condition is not extreme.
(True/False)
4.8/5 (32)
If the lower and upper confidence limits of the population mean μ,using a sample of size 100,are 225 and 280,respectively,then the lower and upper confidence limits of the total of a population of size 3000 are respectively
(Multiple Choice)
4.9/5 (31)
Filters
- Essay(0)
- Multiple Choice(0)
- Short Answer(0)
- True False(0)
- Matching(0)