Exam 16: Quality Control and Spc
Exam 1: Goods, Services, and Operations Management65 Questions
Exam 2: Value Chains68 Questions
Exam 3: Measuring Performance in Operations81 Questions
Exam 4: Operations Strategy65 Questions
Exam 5: Technology and Operations Management72 Questions
Exam 6: Goods and Service Design91 Questions
Exam 7: Process Selection, Design, and Analysis89 Questions
Exam 8: Facility and Work Design79 Questions
Exam 9: Supply Chain Design71 Questions
Exam 10: Capacity Management70 Questions
Exam 11: Forecasting and Demand Planning76 Questions
Exam 12: Managing Inventories89 Questions
Exam 13: Resource Management82 Questions
Exam 14: Operations Scheduling and Sequencing65 Questions
Exam 15: Quality Management73 Questions
Exam 16: Quality Control and Spc85 Questions
Exam 17: Lean Operating Systems63 Questions
Exam 18: Project Management60 Questions
Select questions type
A bottling machine fills soft drink bottles with an average of 12.000 ounces with a standard deviation of 0.002 ounces. Determine the process capability index, Cp, if the design specification for the fill weight of the bottles is 12.000 ounces plus or minus 0.015 ounces.
(Essay)
4.7/5  (31)
(31)
A manufacturer inspected 40 circuit boards and found a total of 640 defects. If the company wants to use SPC to control the manufacturing process by monitoring the number of defects per circuit board, what type of chart should they use and what should the control limits be?
(Essay)
4.9/5 (41)
Five samples were taken, with five observations each. The sample findings are listed below. The sample values represent service times in minutes. 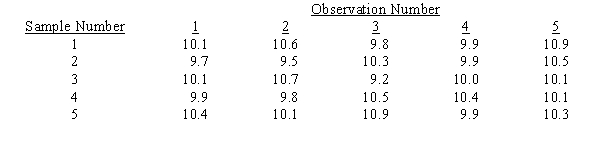 a.Determine the control limits for the R-chart.
b.Would you conclude the R-chart is in statistical control and proceed to develop the x-bar chart?
a.Determine the control limits for the R-chart.
b.Would you conclude the R-chart is in statistical control and proceed to develop the x-bar chart?
(Essay)
4.7/5 (30)
The value of Cpk is the average of the lower and upper capability indexes; that is, Cpk = (Cpl + Cpu)/2.
(True/False)
4.8/5 (35)
If one was monitoring the average time to load a web page, the chart to use would be the
(Multiple Choice)
4.8/5 (38)
Filters
- Essay(0)
- Multiple Choice(0)
- Short Answer(0)
- True False(0)
- Matching(0)