Exam 16: Quality Control and Spc
Exam 1: Goods, Services, and Operations Management65 Questions
Exam 2: Value Chains68 Questions
Exam 3: Measuring Performance in Operations81 Questions
Exam 4: Operations Strategy65 Questions
Exam 5: Technology and Operations Management72 Questions
Exam 6: Goods and Service Design91 Questions
Exam 7: Process Selection, Design, and Analysis89 Questions
Exam 8: Facility and Work Design79 Questions
Exam 9: Supply Chain Design71 Questions
Exam 10: Capacity Management70 Questions
Exam 11: Forecasting and Demand Planning76 Questions
Exam 12: Managing Inventories89 Questions
Exam 13: Resource Management82 Questions
Exam 14: Operations Scheduling and Sequencing65 Questions
Exam 15: Quality Management73 Questions
Exam 16: Quality Control and Spc85 Questions
Exam 17: Lean Operating Systems63 Questions
Exam 18: Project Management60 Questions
Select questions type
Common cause variation generally accounts for about 10 to 15% of all variation within a process.
(True/False)
4.9/5  (35)
(35)
Which of the following suggests a process that is not in control?
(Multiple Choice)
4.8/5 (38)
A production process is sampled 24 times with a sample size of 6 yields an overall mean of 25.2 and an average range of 0.8. Determine the control limits for the x-bar and R-charts.
(Essay)
4.8/5 (31)
If no special causes affect the output of a process, we say that the process is ____; when special causes are present, the process is said to be ____.
(Multiple Choice)
4.8/5 (32)
A steel company is interested in determining if a particular process in its mini-mill is capable of meeting customer expectations. The thickness of steel has an upper limit of .540 mm and a lower limit of .480 mm. The process has a standard deviation of .02 mm.
a.What is the process capability index (Cp) for this process?
b.What must the standard deviation of the process be changed to for the Cp to equal 1.00?
(Essay)
4.9/5 (37)
Fifteen samples of size 5 have been taken from a production process. The sum of the sample averages was found to be 92.54 cm while the sum of the ranges was 115.36. Find the values of the center lines for the x-bar and R-charts.
(Essay)
4.8/5 (41)
An airline found that on average, 0.62% of the luggage they received from passengers at LAX (Los Angeles Airport) is lost or damaged. On a typical day, 1000 pieces of luggage pass through this airport. What are the control limits for a p-chart for monitoring the daily fraction nonconforming?
(Essay)
4.9/5 (34)
A high-paced discount store in Los Angeles has noticed that checking errors have increased recently. They plan to use control charts with three standard deviation control limits to monitor the process. They decided to take a sample of 100 transactions over each of 10 days. The number of transactions in error for each day was 5, 7, 6, 5, 6, 4, 6, 3, 10, and 8.
a.What is the center line for the p-chart?
b.What is the upper control limit for the p-chart?
c.What is the lower control limit for the p-chart?
(Essay)
4.8/5 (48)
The time to check out guests at a hotel was measured over the course of several weeks. Management believes that the target time for checking out guests should be between 2 and 4 minutes with a target of 3 minutes. The data gathered had a mean time of 2.75 minutes with a standard deviation of 0.4 minutes. Find and interpret Cp, Cpl, Cpu, and Cpk in the context of this situation.
(Essay)
4.8/5 (38)
A company is measuring the time it takes to complete an order. Twenty-five samples of size 6 resulted in an average time of 80 minutes with an average range of 20 minutes. Find control limits for the appropriate control chart(s) that would be used to monitor this process.
(Essay)
4.9/5 (42)
Flaws are counted on a standard steel plate (sheet). Each sheet has the exact same dimensions. Ten sheets are selected at random and the number of flaws per sheet is as follows: 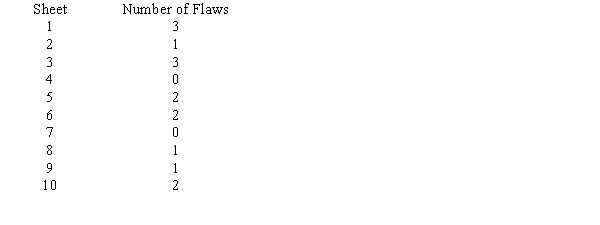 Determine the lower and upper control limits for a c-chart.
(Essay)
4.9/5 (48)
In the 1:10:100 Rule, which of the following would be correct?
(Multiple Choice)
4.7/5 (32)
To monitor the fraction of printed circuit boards that do not pass a functional test, a(n) ____ is used.
(Multiple Choice)
4.9/5 (36)
A Procter and Gamble factory process fills boxes with detergent. Construct an appropriate set of control charts to monitor the process. Historical data for fill weight (in ounces) of eight samples is presented below. A sample size of six was used. 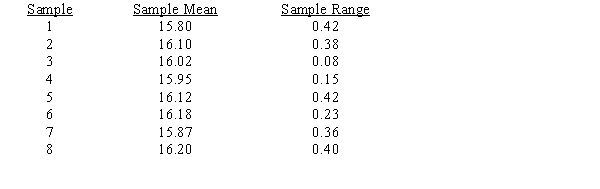 a.Compute the limits for both an R-chart and x-bar chart. Compare the sample results to the limits of the charts.
b.Briefly explain what the quality control charts tell you. What actions, if any, would you take?
a.Compute the limits for both an R-chart and x-bar chart. Compare the sample results to the limits of the charts.
b.Briefly explain what the quality control charts tell you. What actions, if any, would you take?
(Essay)
4.8/5 (32)
A bottling process sometimes results in overfills or underfills. Overfills are especially damaging to the equipment. Which process capability index would this company most want to monitor?
(Multiple Choice)
4.8/5 (41)
Historically, the average proportion of defective bars has been 0.015. Samples of 100 bars each are taken. Construct a p-chart using z = 3. Suppose a sample had 0.044 defectives. What would you do?
(Multiple Choice)
4.7/5 (38)
Filters
- Essay(0)
- Multiple Choice(0)
- Short Answer(0)
- True False(0)
- Matching(0)