Exam 3: Numerical Descriptive Measures
Exam 1: Statistics and Data102 Questions
Exam 2: Tabular and Graphical Methods123 Questions
Exam 3: Numerical Descriptive Measures152 Questions
Exam 4: Introduction to Probability148 Questions
Exam 5: Discrete Probability Distributions158 Questions
Exam 6: Continuous Probability Distributions143 Questions
Exam 7: Sampling and Sampling Distributions136 Questions
Exam 8: Interval Estimation131 Questions
Exam 9: Hypothesis Testing116 Questions
Exam 10: Statistical Inference Concerning Two Populations131 Questions
Exam 11: Statistical Inference Concerning Variance120 Questions
Exam 12: Chi-Square Tests120 Questions
Exam 13: Analysis of Variance120 Questions
Exam 14: Regression Analysis140 Questions
Exam 15: Inference With Regression Models125 Questions
Exam 16: Regression Models for Nonlinear Relationships118 Questions
Exam 17: Regression Models With Dummy Variables130 Questions
Exam 18: Time Series and Forecasting125 Questions
Exam 19: Returns, Index Numbers, and Inflation120 Questions
Exam 20: Nonparametric Tests120 Questions
Select questions type
In its standard form, Chebyshev's theorem provides a lower bound on ________.
(Multiple Choice)
4.9/5  (34)
(34)
Professors at a local university earn an average salary of $80,000 with a standard deviation of $6,000. The salary distribution is approximately bell-shaped. What can be said about the percentage of salaries that are at least $74,000?
(Multiple Choice)
4.9/5 (31)
As of September 30, the earnings per share (EPS) of five firms in the biotechnology industry are  (See the Excel Data File.) The sample mean and the sample standard deviation are the closest to ________.
(Multiple Choice)
4.8/5 (38)
The z-score has no units even though the original values will normally be expressed in units such as dollars, years, pounds, or calories.
(True/False)
4.9/5 (32)
The following frequency distribution represents the number of hours studied per week by a sample of 50 students.  (See the Excel Data File.) The mean number of hours studied is ________.
(Multiple Choice)
4.9/5 (30)
The mean starting salary of recent business graduates at a university is $52,000 with a standard deviation of $16,000. The distribution of starting salaries is assumed to be symmetric and bell-shaped.
A) What proportion of business graduates has a starting salary between $20,000 and $84,000.
B) Suppose 600 business graduates from this university got hired. How many of them started with a salary between $20,000 and $84,000?
(Essay)
4.8/5 (36)
The following data represent the wait time, in minutes, for customers calling Dell technical support.  (See the Excel Data File.) The upper limit for determining outliers for a box-and-whisker plot is ________.
(Multiple Choice)
4.8/5 (19)
The empirical rule is only applicable for approximately bell-shaped data.
(True/False)
4.7/5 (38)
The director of graduate admissions is analyzing the relationship between scores in the GRE and student performance in graduate school, as measured by a student's GPA. The table below shows a sample of 10 students.  (See the Excel Data File.) Which of the following statements is correct?
(Multiple Choice)
5.0/5 (34)
An analyst gathered the following information about the net profit margins of companies in two industries:  Compared with the other industry, the relative dispersion of net profit margins is smaller for Industry ________.
(Multiple Choice)
4.8/5 (36)
The Boom company has recently decided to raise the salaries of all employees by 10%. Which of the following is (are) expected to be affected by this raise?
(Multiple Choice)
4.8/5 (34)
The data show operating expenses (in millions) for British Petroleum for the years Year 1 to Year 3.  a. Use the growth rates from Year 1 − 2 and Year 2 − Year 3 to calculate the average growth rate.
B) Calculate the average growth rate directly from sales.
a. Use the growth rates from Year 1 − 2 and Year 2 − Year 3 to calculate the average growth rate.
B) Calculate the average growth rate directly from sales.
(Short Answer)
4.8/5 (40)
Amounts spent by a sample of 50 customers at a retail store are summarized in the following relative frequency distribution.  (See the Excel Data File.) The mean amount spent by customers is the closest to ________.
(Multiple Choice)
4.9/5 (29)
The mean starting salary of recent business graduates at a university is $52,000 with a standard deviation of $16,000. The distribution of starting salaries is unknown.
A) What proportion of business graduates has a starting salary between $20,000 and $84,000?
B) Suppose 600 business graduates from this university got hired. How many of them started with a salary between $20,000 and $84,000?
(Essay)
4.9/5 (48)
A college professor collected data on the number of hours spent by his 100 students over the weekend to prepare for Monday's Business Statistics exam. He processed the data by Excel and the following incomplete output is available. 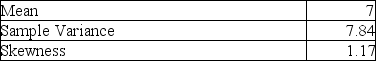 The coefficient of variation in the data is ________.
(Multiple Choice)
4.9/5 (33)
In a data set, an outlier is a large or small value regarded as an extreme value in the data set.
(True/False)
4.9/5 (36)
The geometric mean is a multiplicative average of a data set used to measure values over a period of time.
(True/False)
4.8/5 (31)
Mean-variance analysis suggests that investments with lower average returns are also associated with higher risks.
(True/False)
4.7/5 (30)
Filters
- Essay(0)
- Multiple Choice(0)
- Short Answer(0)
- True False(0)
- Matching(0)