Exam 3: Numerical Descriptive Measures
Exam 1: Statistics and Data102 Questions
Exam 2: Tabular and Graphical Methods123 Questions
Exam 3: Numerical Descriptive Measures152 Questions
Exam 4: Introduction to Probability148 Questions
Exam 5: Discrete Probability Distributions158 Questions
Exam 6: Continuous Probability Distributions143 Questions
Exam 7: Sampling and Sampling Distributions136 Questions
Exam 8: Interval Estimation131 Questions
Exam 9: Hypothesis Testing116 Questions
Exam 10: Statistical Inference Concerning Two Populations131 Questions
Exam 11: Statistical Inference Concerning Variance120 Questions
Exam 12: Chi-Square Tests120 Questions
Exam 13: Analysis of Variance120 Questions
Exam 14: Regression Analysis140 Questions
Exam 15: Inference With Regression Models125 Questions
Exam 16: Regression Models for Nonlinear Relationships118 Questions
Exam 17: Regression Models With Dummy Variables130 Questions
Exam 18: Time Series and Forecasting125 Questions
Exam 19: Returns, Index Numbers, and Inflation120 Questions
Exam 20: Nonparametric Tests120 Questions
Select questions type
In what way(s) is(are) the concept of geometric mean useful?
(Multiple Choice)
4.7/5  (34)
(34)
The Yearly Prices (rounded to the nearest dollar) for GLD (a gold exchange traded fund) and SLV (a silver exchange traded fund) are reported in the following table.  (See the Excel Data File.)
A) Calculate the sample variance and sample standard deviation for the GLD ETF and SLV ETF.
B) Which asset had a greater variance?
C) Which asset had the greater relative dispersion?
(See the Excel Data File.)
A) Calculate the sample variance and sample standard deviation for the GLD ETF and SLV ETF.
B) Which asset had a greater variance?
C) Which asset had the greater relative dispersion?
(Essay)
4.9/5 (28)
Approximately 60% of the observations in a data set fall below the 60th percentile.
(True/False)
4.8/5 (34)
The following is a list of average wind speeds at a local surf spot in California over the last week.  (See the Excel Data File.)
A) What is the range in wind speed?
B) What is the Mean Absolute Deviation of the wind speed?
(See the Excel Data File.)
A) What is the range in wind speed?
B) What is the Mean Absolute Deviation of the wind speed?
(Essay)
4.7/5 (36)
A bowler's scores for a sample of six games were  The bowler's modal score is ________.
(Multiple Choice)
4.8/5 (36)
A surfer visited his favorite beach 50 times and recorded the wave height each time in the following table. 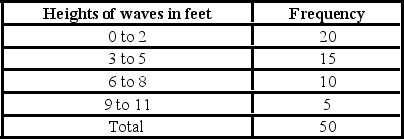 (See the Excel Data File.)
A) Calculate the average wave height.
B) Calculate the variance and standard deviation wave height for this sample.
(See the Excel Data File.)
A) Calculate the average wave height.
B) Calculate the variance and standard deviation wave height for this sample.
(Essay)
4.9/5 (27)
A luxury apartment complex in South Beach Miami is for sale. The owner has received the following offers in millions of dollars.  (See the Excel Data File.)
A) What is the mean offer price? What is the median offer price? Is the mean a good measure of central location?
B) What is the sample standard deviation of the offers?
C) What is equivalent to a 75th percentile offer?
(See the Excel Data File.)
A) What is the mean offer price? What is the median offer price? Is the mean a good measure of central location?
B) What is the sample standard deviation of the offers?
C) What is equivalent to a 75th percentile offer?
(Essay)
4.8/5 (37)
The following table shows the annual returns (in percent) Chevron and Caterpillar for  .
.  (See the Excel Data File.)
A) Which fund had the higher arithmetic average return?
B) Which fund was riskier over this time period?
C) Given a risk-free rate of 1%, which fund has the higher Sharpe ratio? What does this imply?
(See the Excel Data File.)
A) Which fund had the higher arithmetic average return?
B) Which fund was riskier over this time period?
C) Given a risk-free rate of 1%, which fund has the higher Sharpe ratio? What does this imply?
(Essay)
4.9/5 (35)
The following table summarizes selected statistics for two portfolios for a 10-year period. Assume that the risk-free rate is 4% over this period.  As measured by the Sharpe ratio, the fund with the superior risk-adjusted performance during this period is ________.
(Multiple Choice)
4.9/5 (25)
Which of the following relationships can be concluded from examining the correlation coefficient?
(Multiple Choice)
4.8/5 (41)
John lives in Los Angeles and hates the traffic. He asked a sample of six of his coworkers who live all over Los Angles how many hours they spend commuting every year. These are their responses in hours per year.  (See the Excel Data File.)
A) Calculate and interpret the 30th, 50th, and 70th percentiles.
B) Are there any outliers? Is the distribution symmetric? If not, comment on its skewness.
(See the Excel Data File.)
A) Calculate and interpret the 30th, 50th, and 70th percentiles.
B) Are there any outliers? Is the distribution symmetric? If not, comment on its skewness.
(Essay)
4.7/5 (36)
Which are characteristic(s) of the coefficient of variation?
(Multiple Choice)
4.8/5 (38)
Professors at a local university earn an average salary of $80,000 with a standard deviation of $6,000. Using Chebyshev's inequality, the percentage of salaries falling between $68,000 and $92,000 is at least ________.
(Multiple Choice)
4.9/5 (40)
The annual returns (in percent) for a sample of stocks in the technology industry over the past year are as follows:  (See the Excel Data File.) The median return is the closest to ________.
(Multiple Choice)
4.8/5 (30)
Automobiles traveling on a road with a posted speed limit of 65 miles per hour are checked for speed by a state police radar system. The following is a frequency distribution of speeds.  (See the Excel Data File.) The mean speed of the automobiles traveling on this road is the closest to ________.
(Multiple Choice)
4.8/5 (31)
The following are daily returns for the Dow Jones Industrial average during the week of October 13. The returns are rounded to the nearest whole number.  (See the Excel Data File.)
A) Calculate the arithmetic mean return.
B) Calculate the geometric mean return.
(See the Excel Data File.)
A) Calculate the arithmetic mean return.
B) Calculate the geometric mean return.
(Essay)
4.9/5 (31)
The terms central location or central tendency refer to the way quantitative data tend to cluster around some middle or central value.
(True/False)
4.9/5 (27)
The following sample data shows the starting salaries of six graduates from the accounting program at California Polytechnic State University. The data are in thousands of dollars.  (See the Excel Data File.)
A) Calculate and interpret the 25th, 50th, and 75th percentiles.
B) Are there any outliers? Is the distribution symmetric? If not, comment on its skewness.
(See the Excel Data File.)
A) Calculate and interpret the 25th, 50th, and 75th percentiles.
B) Are there any outliers? Is the distribution symmetric? If not, comment on its skewness.
(Essay)
4.8/5 (23)
You buy 50 stocks of Company A, 30 of Company B, and 20 of Company C. The annual returns of these companies are 8%, 12%, and 10% respectively. The average return for one year is the closest to ________.
(Multiple Choice)
4.9/5 (31)
Filters
- Essay(0)
- Multiple Choice(0)
- Short Answer(0)
- True False(0)
- Matching(0)