Exam 3: Numerical Descriptive Measures
Exam 1: Statistics and Data102 Questions
Exam 2: Tabular and Graphical Methods123 Questions
Exam 3: Numerical Descriptive Measures152 Questions
Exam 4: Introduction to Probability148 Questions
Exam 5: Discrete Probability Distributions158 Questions
Exam 6: Continuous Probability Distributions143 Questions
Exam 7: Sampling and Sampling Distributions136 Questions
Exam 8: Interval Estimation131 Questions
Exam 9: Hypothesis Testing116 Questions
Exam 10: Statistical Inference Concerning Two Populations131 Questions
Exam 11: Statistical Inference Concerning Variance120 Questions
Exam 12: Chi-Square Tests120 Questions
Exam 13: Analysis of Variance120 Questions
Exam 14: Regression Analysis140 Questions
Exam 15: Inference With Regression Models125 Questions
Exam 16: Regression Models for Nonlinear Relationships118 Questions
Exam 17: Regression Models With Dummy Variables130 Questions
Exam 18: Time Series and Forecasting125 Questions
Exam 19: Returns, Index Numbers, and Inflation120 Questions
Exam 20: Nonparametric Tests120 Questions
Select questions type
Professors at a local university earn an average salary of $80,000 with a standard deviation of $6,000. With the beginning of the next academic year, all professors will get a 2% raise. What will be the average and the standard deviation of their new salaries?
Free
(Multiple Choice)
4.8/5  (33)
(33)
Correct Answer: Verified
C
Your used car is expected to last an average of 200,000 miles with a standard deviation of 25,000 miles before it requires a new transmission.
A) Use Chebyshev's Theorem to approximate the probability that the engine will last between 150,000 miles and 250,000 miles.
B) Assume a symmetric bell-shaped distribution to approximate the probability that the engine will last between 150,000 miles and 250,000 miles.
Free
(Essay)
4.8/5 (39)
Correct Answer:Verified
a. At least 75% of the time. 150,000 & 250,000 are 2 standard deviations below/above the mean 200,000 ± 2 × 25,000 Chebyshev's Theorem: 1 − 1/(22) = 75%
b. About 95% of the time
Chebyshev's theorem is applicable when the data are ________.
Free
(Multiple Choice)
5.0/5 (31)
Correct Answer:Verified
A
Consider a population with data values of  (See the Excel Data File.) The population standard deviation is the closest to ________.
(Multiple Choice)
4.8/5 (40)
Suppose the dealer incentive per vehicle for Honda's Acura brand is thought to be bell-shaped and symmetrical with a mean of $2,500 and a standard deviation of $300. Based on this information, what interval of dealer incentives would we expect approximately 99.7% of vehicles to fall within?
(Multiple Choice)
4.8/5 (35)
The covariance between the returns of stock A and stock B is -125. The standard deviation of the rates of return is 20 for stock A and 10 for stock B. The correlation coefficient of the rates of return between A and B is closest to ________.
(Multiple Choice)
4.9/5 (26)
The covariance between the returns of A and B is -0.112. The standard deviation of the rates of return is 0.26 for stock A and 0.81 for stock B. The correlation of the rates of return between A and B is the closest to ________.
(Multiple Choice)
4.7/5 (29)
The covariance between the returns on two assets is negative. This occurs when ________.
(Multiple Choice)
4.7/5 (23)
Amounts spent by a sample of 200 customers at a retail store are summarized in the following relative frequency distribution.  (See the Excel Data File.) The mean amount spent by customers is the closest to ________.
(Multiple Choice)
4.9/5 (37)
In quality control settings, businesses prefer a larger standard deviation, which is an indication of more consistency in the process.
(True/False)
4.9/5 (39)
The sample data below shows the number of hours spent by five students over the weekend to prepare for Monday's Business Statistics exam.  (See the Excel Data File.) The mean and the median of the numbers of hours spent by the five students are ________.
(Multiple Choice)
4.7/5 (35)
The following is return data for a retail sector ETF and energy sector ETF for the years, Year 1 to Year 5. 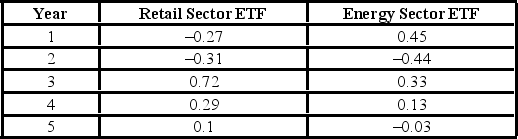 (See the Excel Data File.)
A) What is the arithmetic mean return for each ETF?
B) What is the geometric mean return for each ETF?
C) What is the sample standard deviation for each ETF? Which ETF was riskier over this time period?
D) Given a risk free rate of 5%, what is the Sharpe Ratio for each ETF? Which investment had a better return per unit of risk over this time period?
(See the Excel Data File.)
A) What is the arithmetic mean return for each ETF?
B) What is the geometric mean return for each ETF?
C) What is the sample standard deviation for each ETF? Which ETF was riskier over this time period?
D) Given a risk free rate of 5%, what is the Sharpe Ratio for each ETF? Which investment had a better return per unit of risk over this time period?
(Essay)
4.9/5 (30)
Yearly returns (rounded to the nearest percent) for GLD (a gold exchange traded fund) and SLV (a silver exchange traded fund) are reported in the following table.  (See the Excel Data File.)
A) Calculate the covariance between GLD and SLV.
B) Calculate and interpret the correlation coefficient.
(See the Excel Data File.)
A) Calculate the covariance between GLD and SLV.
B) Calculate and interpret the correlation coefficient.
(Essay)
4.8/5 (31)
Which of the following is not true concerning the attributes of z-scores?
(Multiple Choice)
4.9/5 (38)
When working with grouped data, the class median is the value in the middle of the class and can be found by taking the average of the endpoints for each class.
(True/False)
4.7/5 (34)
A portfolio's annual total returns (in percent) for a five-year period are:  (See the Excel Data File.) The median and the standard deviation for this sample are the closest to ________.
(Multiple Choice)
4.8/5 (36)
Consider a population with data values of  (See the Excel Data File.) The population variance is the closest to ________.
(Multiple Choice)
4.8/5 (29)
The coefficient of variation is a unit-free measure of dispersion.
(True/False)
4.7/5 (36)
Filters
- Essay(0)
- Multiple Choice(0)
- Short Answer(0)
- True False(0)
- Matching(0)