Exam 2: Tabular and Graphical Methods
Exam 1: Statistics and Data102 Questions
Exam 2: Tabular and Graphical Methods123 Questions
Exam 3: Numerical Descriptive Measures152 Questions
Exam 4: Introduction to Probability148 Questions
Exam 5: Discrete Probability Distributions158 Questions
Exam 6: Continuous Probability Distributions143 Questions
Exam 7: Sampling and Sampling Distributions136 Questions
Exam 8: Interval Estimation131 Questions
Exam 9: Hypothesis Testing116 Questions
Exam 10: Statistical Inference Concerning Two Populations131 Questions
Exam 11: Statistical Inference Concerning Variance120 Questions
Exam 12: Chi-Square Tests120 Questions
Exam 13: Analysis of Variance120 Questions
Exam 14: Regression Analysis140 Questions
Exam 15: Inference With Regression Models125 Questions
Exam 16: Regression Models for Nonlinear Relationships118 Questions
Exam 17: Regression Models With Dummy Variables130 Questions
Exam 18: Time Series and Forecasting125 Questions
Exam 19: Returns, Index Numbers, and Inflation120 Questions
Exam 20: Nonparametric Tests120 Questions
Select questions type
The accompanying relative frequency distribution represents the last year car sales for the sales force at Kelly's Mega Used Car Center.  If Kelly's employs 100 salespeople, how many of these salespeople have sold at least 45 but fewer than 65 cars in the last year?
Free
(Multiple Choice)
4.8/5  (37)
(37)
Correct Answer: Verified
D
The accompanying chart shows the numbers of books written by each author in a collection of cookbooks. What type of chart is this? 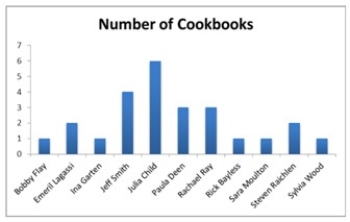
Free
(Multiple Choice)
4.8/5 (33)
Correct Answer:Verified
A
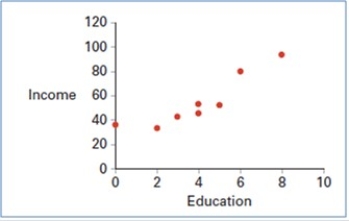 Using a scatterplot above we observe a ________ linear relationship between two variables: Education and Income.
Free
(Short Answer)
4.8/5 (31)
Correct Answer:Verified
positive
Construct a stem-and-leaf diagram for the following data set.  (See the Excel Data File.)
Is the distribution symmetric?
(See the Excel Data File.)
Is the distribution symmetric? 
(Essay)
4.9/5 (35)
Thirty students at Eastside High School took the SAT on the same Saturday. Their raw scores are given next.  (See the Excel Data File.) Consider a frequency distribution of the data that groups the data in classes of 1400 up to 1600, 1600 up to 1800, 1800 up to 2000, and so on. How many students scored at least 1800 but less than 2000?
(Multiple Choice)
4.9/5 (34)
In the following pie chart representing a collection of cookbooks, which author has more titles? 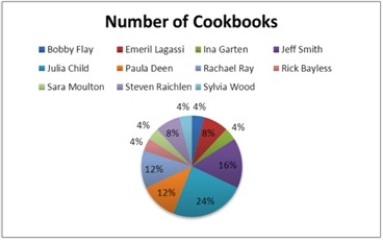
(Multiple Choice)
4.8/5 (31)
The following table shows the percentage of e-mail that is sent each day of the business week according to an Intermedia survey.  Which of the following best displays this data?
(Multiple Choice)
4.8/5 (34)
The following table shows analyst sentiment ratings for the 30 stocks listed in the Dow Jones Industrial Average.  (See the Excel Data File.)
A) Construct a frequency distribution, relative frequency distribution, cumulative frequency distribution and relative cumulative frequency distribution using classes of 2 up to 4, 4 up to 6, 6 up to 8, and 8 up to 10.
B) Construct a histogram that summarizes the data.
C) What percentage of the stocks in the Dow Jones Industrial Average received a sentiment rating less than 8?
D) What percentage of the stocks in the Dow Jones Industrial Average received a sentiment rating of 6 or more?
(See the Excel Data File.)
A) Construct a frequency distribution, relative frequency distribution, cumulative frequency distribution and relative cumulative frequency distribution using classes of 2 up to 4, 4 up to 6, 6 up to 8, and 8 up to 10.
B) Construct a histogram that summarizes the data.
C) What percentage of the stocks in the Dow Jones Industrial Average received a sentiment rating less than 8?
D) What percentage of the stocks in the Dow Jones Industrial Average received a sentiment rating of 6 or more?
(Essay)
4.9/5 (43)
A scatterplot is a graphical tool that helps determine whether or not two quantitative variables are related.
(True/False)
4.8/5 (40)
A city in California spent $6 million repairing damage to its public buildings in Year 1. The following table shows the categories where the money was directed.  How much more did the city spend to fix damage caused by termites compared to the damage caused by water?
(Multiple Choice)
4.8/5 (40)
The accompanying chart shows the number of books written by each author in a collection of cookbooks. What type of data is being represented? 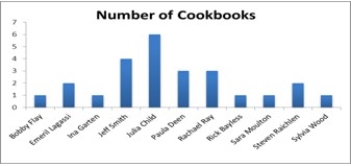
(Multiple Choice)
4.9/5 (34)
When summarizing quantitative data it is always better to have up to 30 classes in a frequency distribution.
(True/False)
4.9/5 (29)
When constructing a scatterplot for two quantitative variables, we usually refer to one variable as x and another one as y. Typically, we graph x on the vertical axis and y on the horizontal axis.
(True/False)
4.7/5 (29)
The organization of the Girl Sprouts has completed its annual cookie drive. The sales are reported in the accompanying ogive. 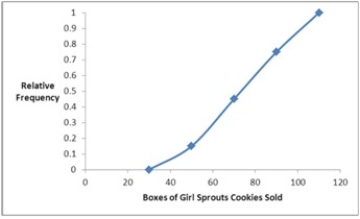 Approximate the percentage of girls who sold less than 90 boxes of cookies.
(Multiple Choice)
4.9/5 (37)
A survey conducted by CBS news asked 1,026 respondents: "What would you do with an unexpected tax refund?" The responses are summarized in the following table. 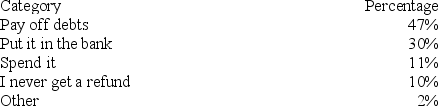 How many people will either put it in the bank or spend it?
(Multiple Choice)
4.7/5 (29)
Construct a stem-and-leaf diagram with the following data set.  (See the Excel Data File.)
Is the distribution symmetric?
(See the Excel Data File.)
Is the distribution symmetric? 
(Essay)
4.9/5 (33)
The following table shows the prices (in $1,000s) of the last 15 trucks sold at a Toyota dealership.  (See the Excel Data File.)
Construct a stem-and-leaf diagram. Given this diagram, estimate the price that a potential buyer would likely pay for a Toyota truck.
(See the Excel Data File.)
Construct a stem-and-leaf diagram. Given this diagram, estimate the price that a potential buyer would likely pay for a Toyota truck.
(Essay)
4.7/5 (39)
For both qualitative and quantitative data, what is the difference between the relative frequency and the percent frequency?
(Multiple Choice)
4.8/5 (28)
The accompanying cumulative relative frequency distribution shows a summary of the scores from an Algebra II exam at a local high school. Twenty students took the exam. 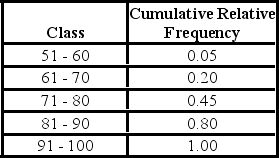 a. Construct the relative frequency distribution. What proportion of students scored between 81 and 90?
B) Construct the frequency distribution. How many students scored between 71 and 80?
C) Construct an ogive. What is the approximate percentage of students that scored less than 85?
a. Construct the relative frequency distribution. What proportion of students scored between 81 and 90?
B) Construct the frequency distribution. How many students scored between 71 and 80?
C) Construct an ogive. What is the approximate percentage of students that scored less than 85?
(Essay)
4.9/5 (39)
An analyst constructed the following frequency distribution on the monthly returns for 50 selected stocks. 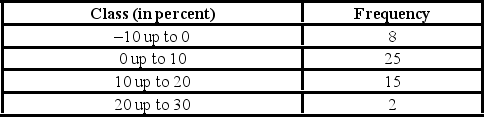 The proportion of stocks with returns of less than 10% is ________.
(Multiple Choice)
4.9/5 (38)
Filters
- Essay(0)
- Multiple Choice(0)
- Short Answer(0)
- True False(0)
- Matching(0)