Exam 11: Statistical Inference Concerning Variance
Exam 1: Statistics and Data102 Questions
Exam 2: Tabular and Graphical Methods123 Questions
Exam 3: Numerical Descriptive Measures152 Questions
Exam 4: Introduction to Probability148 Questions
Exam 5: Discrete Probability Distributions158 Questions
Exam 6: Continuous Probability Distributions143 Questions
Exam 7: Sampling and Sampling Distributions136 Questions
Exam 8: Interval Estimation131 Questions
Exam 9: Hypothesis Testing116 Questions
Exam 10: Statistical Inference Concerning Two Populations131 Questions
Exam 11: Statistical Inference Concerning Variance120 Questions
Exam 12: Chi-Square Tests120 Questions
Exam 13: Analysis of Variance120 Questions
Exam 14: Regression Analysis140 Questions
Exam 15: Inference With Regression Models125 Questions
Exam 16: Regression Models for Nonlinear Relationships118 Questions
Exam 17: Regression Models With Dummy Variables130 Questions
Exam 18: Time Series and Forecasting125 Questions
Exam 19: Returns, Index Numbers, and Inflation120 Questions
Exam 20: Nonparametric Tests120 Questions
Select questions type
If s2 is computed from a random sample of n observations drawn from an underlying normal population with a finite variance, then the  variable is defined as
Free
(Multiple Choice)
4.8/5  (36)
(36)
Correct Answer: Verified
B
The formula for the confidence interval of the population variance σ2 is valid for the random samples drawn from any population.
Free
(True/False)
4.9/5 (29)
Correct Answer:Verified
False
A random sample of 18 observations is taken from a normal population. The sample mean and sample standard deviation are 76.4 and 4.2, respectively. What is an 80% interval estimate of the population variance?
Free
(Multiple Choice)
4.9/5 (36)
Correct Answer:Verified
A
Which of the following characteristics is true regarding the F distribution?
(Multiple Choice)
4.8/5 (32)
The estimator of  /
/  used in the inference regarding the ratio of two population variances is
  /
/  .
.
(True/False)
4.9/5 (20)
Which of the following is a 98% confidence interval for the population variance when the sample variance is 20 for a sample of 10 items from a normal population?
(Multiple Choice)
4.9/5 (38)
A financial analyst examines the performance of two mutual funds and claims that the variances of the annual returns for the bond funds differ. To support his claim, he collects data on the annual returns (in percent) for the years 2001 through 2010. The analyst assumes that the annual returns for the two emerging market bond funds are normally distributed. Use the following summary statistics. 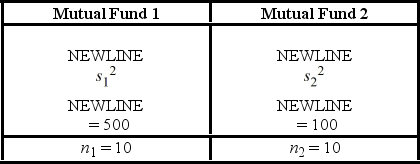 The competing hypotheses are Η0:
  /
/  = 1, ΗA:
  /
/  ≠ 1. Which of the following is the critical F value at the 10% significance level?
(Multiple Choice)
4.9/5 (38)
Amie Jackson, a manager at Sigma travel services, makes every effort to ensure that customers attempting to make online reservations do not have to wait too long to complete the reservation process. The travel website is open for reservations 24 hours a day, and Amie regularly checks the website for the waiting time to maintain consistency in service. She uses the following independently drawn samples of wait time during two peak hours, morning 8 a.m. to 10 a.m. and evening 7 p.m. to 9 p.m., for the analysis. Assume that wait times are normally distributed.  Which of the following is the correct value of the test statistic?
(Multiple Choice)
4.8/5 (29)
A financial analyst examines the performance of two mutual funds and claims that the variances of the annual returns for the bond funds differ. To support his claim, he collects data on the annual returns (in percent) for the years 2001 through 2010. The analyst assumes that the annual returns for the two emerging market bond funds are normally distributed. Use the following summary statistics.  For the competing hypotheses Η0:
  /
/  = 1, ΗA:
  /
/  ≠ 1, which of the following is the correct approximation of the p-value?
(Multiple Choice)
4.9/5 (34)
Which of the following is the value of x for which P  = 0.025?
(Multiple Choice)
4.8/5 (43)
Find  and
and  under the following scenarios.
A) A 90% confidence level with n = 10.
B) A 95% confidence level with n = 15.
C) A 99% confidence level with n = 20.
under the following scenarios.
A) A 90% confidence level with n = 10.
B) A 95% confidence level with n = 15.
C) A 99% confidence level with n = 20.
(Essay)
4.9/5 (27)
Which of the following Excel's functions is used to calculate the right-tailed probability for a value x on the  distribution?
(Multiple Choice)
4.9/5 (31)
In general, the  distribution is the probability distribution of the sum of several independent squared standard ________ random variables.
(Short Answer)
4.7/5 (38)
Find the value x for which
A) P(  ≥ x) = 0.005.
B) P(
≥ x) = 0.005.
B) P(  > x) = 0.025.
C) P(
> x) = 0.025.
C) P(  < x) = 0.005.
D) P(
< x) = 0.005.
D) P(  < x) = 0.025.
(Short Answer)
4.8/5 (32)
A random sample of 21 pages is used to estimate the population variance of the number of typographical errors in a book. The sample mean and sample standard deviation are calculated as 7.34 and 5.11, respectively. Assume that the population is normally distributed.
A) Construct a 95% interval estimate of the population variance.
B) Construct a 99% interval estimate of the population variance.
C) Use your answers to discuss the impact of the confidence level on the width of the interval.
(Essay)
4.8/5 (31)
Edmunds.com would like to test the hypothesis that the standard deviation for the age of an imported car on the road is greater than the standard deviation for the age of a domestic car. The following data shows the ages of a random sample of import and domestic cars.  Which of the following would be the correct value of the test statistic?
(Multiple Choice)
4.9/5 (36)
Find the value x for which
A) P(F(6.4) ≥ x) = 0.01.
B) P(F(6.4) < x) = 0.01.
C) P(F(7.9) ≤ x) = 0.10.
D) P(F(6.4) < x) = 0.10.
(Short Answer)
4.9/5 (34)
Edmunds.com would like to test the hypothesis that the standard deviation for the age of an imported car on the road is greater than the standard deviation for the age of a domestic car. The following data shows the ages of a random sample of import and domestic cars.  Which of the following would be the correct hypothesis test?
(Multiple Choice)
4.8/5 (32)
We conduct the following hypothesis test H0: σ2 = 82, HA: σ2 ≠ 82. For a random sample of 15 observations, the sample standard deviation is 12. Which of the following is the correct approximation of the p-value used to conduct this test?
(Multiple Choice)
4.7/5 (38)
The manager of a video library would like the variance of the waiting times of the customers not to exceed 2.30 minutes-squared. He would like to add an additional billing counter if the variance exceeds the cut-off. He checks the recent sample data. For a random sample of 24 customer waiting times, he arrives at a sample variance of 3.8 minutes-squared. The manager assumes the waiting times to be normally distributed. Which of the following is the correct approximation of the p-value used to conduct this test?
(Multiple Choice)
4.9/5 (36)
Filters
- Essay(0)
- Multiple Choice(0)
- Short Answer(0)
- True False(0)
- Matching(0)