Exam 18: Time Series and Forecasting
Exam 1: Statistics and Data102 Questions
Exam 2: Tabular and Graphical Methods123 Questions
Exam 3: Numerical Descriptive Measures152 Questions
Exam 4: Introduction to Probability148 Questions
Exam 5: Discrete Probability Distributions158 Questions
Exam 6: Continuous Probability Distributions143 Questions
Exam 7: Sampling and Sampling Distributions136 Questions
Exam 8: Interval Estimation131 Questions
Exam 9: Hypothesis Testing116 Questions
Exam 10: Statistical Inference Concerning Two Populations131 Questions
Exam 11: Statistical Inference Concerning Variance120 Questions
Exam 12: Chi-Square Tests120 Questions
Exam 13: Analysis of Variance120 Questions
Exam 14: Regression Analysis140 Questions
Exam 15: Inference With Regression Models125 Questions
Exam 16: Regression Models for Nonlinear Relationships118 Questions
Exam 17: Regression Models With Dummy Variables130 Questions
Exam 18: Time Series and Forecasting125 Questions
Exam 19: Returns, Index Numbers, and Inflation120 Questions
Exam 20: Nonparametric Tests120 Questions
Select questions type
Which of the following is a causal forecasting method?
Free
(Multiple Choice)
4.9/5  (36)
(36)
Correct Answer: Verified
D
Prices of crude oil have been steadily rising over the last two years (The Wall Street Journal, December 14, 2010). The monthly data on price per gallon of unleaded regular gasoline in the United States from January 2009 to December 2010 were available. Three trend models were created starting with t = 1 and the following output was generated.  Using the cubic trend equation, which of the following would be the forecast for the price of regular unleaded gasoline for January 2011?
Free
(Multiple Choice)
4.9/5 (32)
Correct Answer:Verified
C
Which of the following is not true of a time series with a cyclical component?
Free
(Multiple Choice)
4.8/5 (34)
Correct Answer:Verified
D
Based on quarterly data collected over the last five years, the following regression equation was found to forecast the quarterly demand for the number of new copies of a business statistics textbook:  t = 2,298 - 335Qtr1 - 1,446Qtr2 + 303Qtr3 + 26t, where Qtr1, Qtr2, and Qtr3 are dummy variables corresponding to Quarters 1, ,2 and 3, and t = time period starting with t = 1. For a given year, the demand in Quarter 4 is on average ________.
(Multiple Choice)
4.7/5 (27)
When the model yt = Tt × St × It is assumed, to identify the ________, we have to find the seasonally adjusted series.
(Multiple Choice)
4.8/5 (45)
The past monthly demands are shown below. The naïve method, that is, the one-period moving average method, is applied to make forecasts. 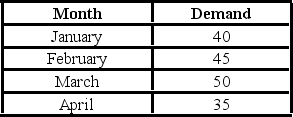 If the demand in May appears to be 35, what is the residual (error) for May?
(Multiple Choice)
4.8/5 (33)
Given the estimated model  t = b0 + b1t, the one-step-ahead and multistep-ahead forecasts are possible, if we know or can predict, future values of the ________.
(Multiple Choice)
4.8/5 (38)
The following table shows the annual revenues (in millions of dollars) of a pharmaceutical company over the period 1990-2011. 
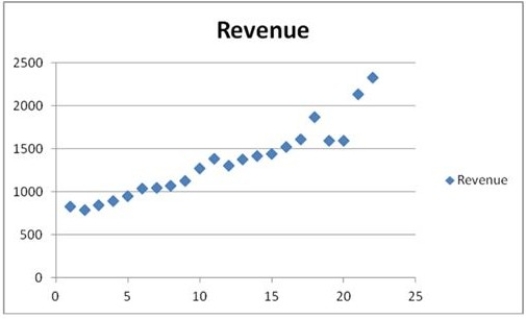 The scatterplot indicates that the annual revenues have an increasing trend. Linear, exponential, quadratic, and cubic models were fit to the data starting with t = 1, and the following output was generated.
  Which of the following is a revenue forecast for 2012 found by the exponential trend equation?
(Multiple Choice)
4.8/5 (38)
________ patterns are caused by the presence of a random error term.
(Short Answer)
4.8/5 (30)
The following table shows the annual revenues (in millions of dollars) of a pharmaceutical company over the period 1990-2011. 
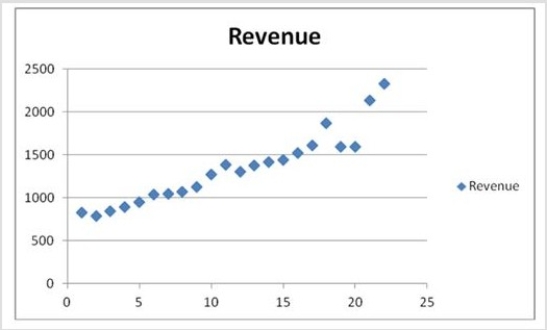 The scatterplot indicates that the annual revenues have an increasing trend. Linear, exponential, quadratic, and cubic models were fit to the data starting with t = 1, and the following output was generated.
  Which of the following is an exponential trend equation?
(Multiple Choice)
4.8/5 (24)
The linear trend model,  t = 660 + 2t starting with t = 1, for seasonally adjusted monthly sales was estimated using monthly data from for five years. Furthermore, the seasonal index for October was found to be 0.92. Which of the following is the forecast for the month of October next year?
(Multiple Choice)
4.7/5 (40)
When a time series is analyzed by the model yt = Tt × St × It, which of the following is valid?
(Multiple Choice)
4.9/5 (36)
When comparing which of the following trend models is the adjusted R2 not used?
(Multiple Choice)
4.9/5 (38)
When the exponential trend model is used to make forecasts, the forecasts are given by  = exp(b0 + b1t +
  /2).
/2).
(True/False)
4.8/5 (35)
When comparing polynomial trend models, we use adjusted R2, which imposes a penalty for ________.
(Short Answer)
4.7/5 (32)
The following table shows the annual revenues (in millions of dollars) of a pharmaceutical company over the period 1990-2011.  The autoregressive models of order 1 and 2, yt = β0 + β1yt - 1 + εt, and yt = β0 + β1yt - 1 + β2yt - 2 + εt, were applied on the time series to make revenue forecasts. The relevant parts of Excel regression outputs are given below.
Model AR(1):
The autoregressive models of order 1 and 2, yt = β0 + β1yt - 1 + εt, and yt = β0 + β1yt - 1 + β2yt - 2 + εt, were applied on the time series to make revenue forecasts. The relevant parts of Excel regression outputs are given below.
Model AR(1): 
 Model AR(2):
 When for AR(1), H0: β0 = 0 is tested against HA: β0 ≠ 0, the p-value of this t test shown the output as 0.9590. This could suggest that the model yt = β1yt-1 + εt might be an alternative to the AR(1) model yt = β0 + β1yt-1 + εt. Partial output for this simplified model is as follows:
 Find the revenue forecast for 2012 through the use of yt = β1yt-1 + εt.
(Essay)
4.8/5 (40)
In the quadratic trend model, yt = β0 + β1t 2 + εt, which coefficient determines if the trend is going to be U-shaped or inverted U-shaped?
(Multiple Choice)
4.8/5 (28)
Ideally, the chosen model is best in terms of its in-sample predictability and its ________ forecasting ability.
(Short Answer)
4.8/5 (22)
Which of the following R functions is used to do the exponential smoothing method?
(Multiple Choice)
4.7/5 (43)
Which of the following is a criticism made of qualitative forecasts?
(Multiple Choice)
4.7/5 (35)
Filters
- Essay(0)
- Multiple Choice(0)
- Short Answer(0)
- True False(0)
- Matching(0)