Exam 12: Chi-Square Tests
Exam 1: Statistics and Data102 Questions
Exam 2: Tabular and Graphical Methods123 Questions
Exam 3: Numerical Descriptive Measures152 Questions
Exam 4: Introduction to Probability148 Questions
Exam 5: Discrete Probability Distributions158 Questions
Exam 6: Continuous Probability Distributions143 Questions
Exam 7: Sampling and Sampling Distributions136 Questions
Exam 8: Interval Estimation131 Questions
Exam 9: Hypothesis Testing116 Questions
Exam 10: Statistical Inference Concerning Two Populations131 Questions
Exam 11: Statistical Inference Concerning Variance120 Questions
Exam 12: Chi-Square Tests120 Questions
Exam 13: Analysis of Variance120 Questions
Exam 14: Regression Analysis140 Questions
Exam 15: Inference With Regression Models125 Questions
Exam 16: Regression Models for Nonlinear Relationships118 Questions
Exam 17: Regression Models With Dummy Variables130 Questions
Exam 18: Time Series and Forecasting125 Questions
Exam 19: Returns, Index Numbers, and Inflation120 Questions
Exam 20: Nonparametric Tests120 Questions
Select questions type
The following table shows the observed frequencies of the amount of assets under management for a sample of 134 hedge funds. The table also contains the hypothesized proportion of each class assuming the amount of assets under management has a normal distribution. The sample mean and standard deviation are 15 billion and 11 billion respectively. 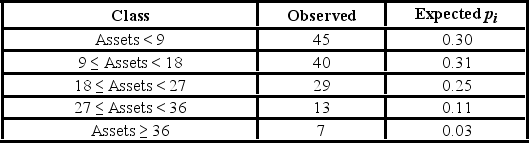 a. Set up the competing hypotheses for the goodness-of-fit test of normality for amount of assets under management.
B) Calculate the value of the test statistic and determine the degrees of freedom.
C) Specify the critical value at the 5% significance level.
D) Is there evidence to suggest the amount of assets under management do not have a normal distribution?
E) Are there any conditions that may not be satisfied?
a. Set up the competing hypotheses for the goodness-of-fit test of normality for amount of assets under management.
B) Calculate the value of the test statistic and determine the degrees of freedom.
C) Specify the critical value at the 5% significance level.
D) Is there evidence to suggest the amount of assets under management do not have a normal distribution?
E) Are there any conditions that may not be satisfied?
Free
(Essay)
4.9/5  (36)
(36)
Correct Answer: Verified
a. H0: Assets follow a normal distribution with mean 15 and standard deviation 11; HA: Assets do not follow a normal distribution with mean 15 and standard deviation 11.
b. 3.649 and the degrees of freedom are 2.
c. 5.991.
d. Because the test statistic value is less than the critical value, do not reject the null hypothesis. We cannot conclude the amount of assets under management does not have a normal distribution.
e. For the at least 36 billion under management class, the expected frequency is 4.02, which is less than 5.
For the goodness-of-fit test, the chi-square test statistic will ________.
Free
(Multiple Choice)
4.8/5 (43)
Correct Answer:Verified
C
In the following table, likely voters' preferences of two candidates are cross-classified by gender.  The p-value is ________.
Free
(Multiple Choice)
4.8/5 (25)
Correct Answer:Verified
C
The heights (in cm) for a random sample of 60 male employees of S&M Construction Company were measured. The sample mean is 166.5, the standard deviation is 12.57, the sample kurtosis is 0.12, and the sample skewness is −0.23. The value of the Jarque-Bera test statistic is ________.
(Multiple Choice)
4.8/5 (32)
In the following table, individuals are cross-classified by their age group and income level.  For the chi-square test of independence, the degrees of freedom are ________.
(Multiple Choice)
4.9/5 (30)
A card-dealing machine deals spades (1), hearts (2), clubs (3), and diamonds (4) at random as if from an infinite deck. In a randomness check, 1,600 cards were dealt and counted. The results are shown below.  Using the p-value approach and α = 0.05, the decision and conclusion are ________.
(Multiple Choice)
4.8/5 (32)
A card-dealing machine deals spades (1), hearts (2), clubs (3), and diamonds (4) at random as if from an infinite deck. In a randomness check, 1,600 cards were dealt and counted. The results are shown below.  To test if the poker-dealing machine deals cards at random, the null and alternative hypotheses are ________.
(Multiple Choice)
4.8/5 (35)
In the following table, individuals are cross-classified by their age group and income level.  The p-value is
(Multiple Choice)
4.9/5 (36)
Suppose Bank of America would like to investigate if the credit score and income level of an individual are independent of one another. Bank of America selected a random sample of 400 adults and asked them to report their credit score range and their income range. The following contingency table presents these results. 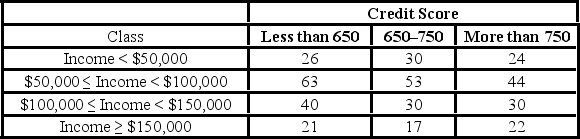 The expected number of individuals with income between $50,000 and $100,000 and a credit score less than 650 is ________.
(Multiple Choice)
4.9/5 (34)
The airline industry defines "no-shows" as passengers who have purchased a ticket but fail to arrive at the gate on time for departure. United Airlines operates many flights from Philadelphia to Dallas. The table below represents the observed number of no-shows that occurred on a random sample of 120 flights between Philadelphia and Dallas this year, and experienced the no-show proportions last year.  United Airlines would like to know if the proportions of no-shows has changed between last year and this year on flights between these two cities using α = 0.05. The critical value for this hypothesis is ________.
(Multiple Choice)
4.9/5 (30)
Suppose Bank of America would like to investigate if the credit score and income level of an individual are independent of one another. Bank of America selected a random sample of 400 adults and asked them to report their credit score range and their income range. The following contingency table presents these results.  The test statistic for this sample is ________.
(Multiple Choice)
4.9/5 (34)
For the goodness-of-fit test, the sum of the expected frequencies must equal ________.
(Multiple Choice)
4.8/5 (38)
The following frequency distribution shows the monthly stock returns for Home Depot for the years 2003 through 2007. 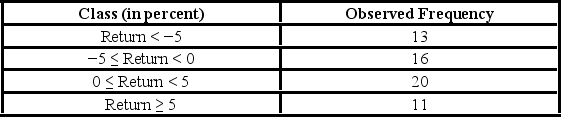 Over the time period, the following summary statistics are provided: Mean = 0.31%, Standard deviation = 6.49%, Skewness = 0.15, and Kurtosis = 0.38. The expected frequency for the class 0 ≤ Return < 5 if the return is normally distributed is ________.
(Multiple Choice)
4.9/5 (36)
A university has six colleges and takes a poll to gauge student support for a tuition increase. The university wants to ensure each college is represented fairly. The below table shows the observed number of students who participate in the poll from each college and the actual proportion of students in each college.  Which of the following is the value of the goodness-of-fit test statistic?
(Multiple Choice)
4.9/5 (37)
In the following table, likely voters' preferences of two candidates are cross-classified by gender.  Using the p-value approach and α = 0.10, the decision and conclusion are ________.
(Multiple Choice)
4.7/5 (34)
A university has six colleges and takes a poll to gauge student support for a tuition increase. The university wants to ensure each college is represented fairly. The below table shows the observed number of students who participate in the poll from each college and the actual proportion of students in each college.  At the 1% significance level, the critical value is ________.
(Multiple Choice)
4.8/5 (39)
In the following table, individuals are cross-classified by their age group and income level.  For the chi-square test of independence, the value of the test statistic is ________.
(Multiple Choice)
4.9/5 (35)
The heights (in cm) for a random sample of 60 males were measured. The sample mean is 166.55, the standard deviation is 12.57, the sample kurtosis is 0.12, and the sample skewness is −0.23. The following table shows the heights subdivided into non-overlapping intervals.  For the heights subdivided into five intervals, the expected frequency of males that weigh less than 150 is ________.
(Multiple Choice)
4.8/5 (35)
The following table shows the distribution of employees in an organization. Martha Foreman, an analyst, wants to see if race has a bearing on the position a person holds with this company.  The row total for Asians is ________.
(Multiple Choice)
4.7/5 (28)
The heights (in cm) for a random sample of 60 male employees of S&M Construction Company were measured. The sample mean is 166.5, the standard deviation is 12.57, the sample kurtosis is 0.12, and the sample skewness is −0.23. The Jarque-Bera test statistic for normality is assumed to follow a  distribution with the following degrees of freedom ________.
(Multiple Choice)
4.7/5 (37)
Filters
- Essay(0)
- Multiple Choice(0)
- Short Answer(0)
- True False(0)
- Matching(0)