Exam 15: Simple Linear Regression and Correlation
Exam 1: A Preview of Business Statistics55 Questions
Exam 2: Visual Description of Data67 Questions
Exam 3: Statistical Description of Data146 Questions
Exam 4: Data Collection and Sampling Methods104 Questions
Exam 5: Probability: Review of Basic Concepts188 Questions
Exam 6: Discrete Probability Distributions140 Questions
Exam 7: Continuous Probability Distributions160 Questions
Exam 8: Sampling Distributions108 Questions
Exam 9: Estimation From Sample Data150 Questions
Exam 10: Hypothesis Tests Involving a Sample Mean or Proportion170 Questions
Exam 11: Hypothesis Tests Involving Two Sample Means149 Questions
Exam 12: Analysis of Variance Tests173 Questions
Exam 13: Chi-Square Applications134 Questions
Exam 14: Nonparametric Methods139 Questions
Exam 15: Simple Linear Regression and Correlation145 Questions
Exam 16: Multiple Regression and Correlation98 Questions
Exam 17: Model Building83 Questions
Exam 18: Models for Time Series and Forecasting127 Questions
Exam 19: Decision Theory82 Questions
Exam 20: Total Quality Management132 Questions
Select questions type
What is spurious correlation? Provide a real or hypothetical example where two variables might exhibit such a relationship.
(Essay)
4.8/5  (32)
(32)
For a given data set of (x,y)values,an infinite number of possible regression equations can be fitted to the corresponding scatter diagram,and each equation will have a unique combination of values for the y-intercept b0 and the slope b1.However,only one equation will be the "best fit" as defined by the least-squares criterion.
(True/False)
4.7/5 (37)
Maintenance Costs
Data was collected to investigate the relationship between the age and annual maintenance costs for a one particular car.The table below shows the costs over the life of a seven-year old car.
Year Annual Maintenance Casts 1 \ 150 2 \ 210 3 \ 450 4 \ 490 5 \ 510 6 \ 1590 7 \ 160
-In testing the hypotheses vs. ,what is the value of the test statistic?
(Short Answer)
4.8/5 (42)
Test the null hypothesis that the true population coefficient of correlation equals zero using the 0.05 significance level.
(Essay)
4.9/5 (31)
Salesperson
The general manager of a chain of furniture stores believes that experience is the most important factor in determining the level of success of a salesperson.To examine this belief she records last month's sales (in $1,000s)and the years of experience of 10 randomly selected salespeople.These data are listed below.
Ealesperson Years of Experience Eales 1 0 7 2 2 9 3 10 20 4 3 15 5 8 18 0 5 14 7 12 20 8 7 17 9 20 30 10 15 25
-Determine the standard error of estimate. = ____________________
Describe what this statistic tells you about the regression line.
(Short Answer)
4.9/5 (40)
If the total variation in y values is 200,and the variation explained by regression line is 180,then the coefficient of determination is equal to ____________________.
(Short Answer)
4.8/5 (31)
If the coefficient of correlation is either ____________________ or ____________________,then the regression line will actually include all of the data points and the line will be a perfect fit.
(Short Answer)
4.8/5 (38)
The assumption of equal standard deviations about the regression line is called _________________________.
(Short Answer)
4.8/5 (35)
A scatter diagram includes the data points:
(x = 2,y = 5),
(x = 4,y = 12),
(x = 6,y = 20),
(x = 8,y = 28),and
(x = 10,y = 30).
Two regression lines are proposed:
(1) = -.6 + 3x
(2) = -1 + 5 x
Using the least squares criterion,which of these regression lines is the better fit to the data? Why?
(Essay)
4.9/5 (28)
GPA
The following table shows the grade point average (GPA)for 5 students along with their entrance exam scores for MBA programs (GMAT).Develop a model that would predict the GPA of a student based on their GMAT score.
Student CPA GMAT 1 3.5 6.7 2 3.1 5.4 3 3.2 4.8 4 4.0 7.0 5 3.6 5.9 6 3.2 5.2 7 3.7 7.2
-Construct a 95% prediction interval for an individual y value when x = 6.5.
(Essay)
4.8/5 (40)
In the sample regression line the term b0 is the y-intercept; this is the value of y where the line intersects the y-axis whenever x = 0.
(True/False)
4.7/5 (23)
Household
The following data was collected by a particular company to determine if a relationship exists between the number of people in a household and weekly food expenditures.
Househald Number in Hausehald Weakly Fadd Expenses 1 2 \ 95 2 3 \ 137 3 5 \ 165 4 2 \ 105 5 4 \ 227 6 4 \ 240 7 5 \ 185
-Calculate the coefficient of determination and interpret the results.
(Essay)
4.9/5 (37)
GPA
The following table shows the grade point average (GPA)for 5 students along with their entrance exam scores for MBA programs (GMAT).Develop a model that would predict the GPA of a student based on their GMAT score.
Student CPA GMAT 1 3.5 6.7 2 3.1 5.4 3 3.2 4.8 4 4.0 7.0 5 3.6 5.9 6 3.2 5.2 7 3.7 7.2
-Determine the standard error of estimate.
(Essay)
5.0/5 (30)
A regression analysis between sales (in $1000)and advertising (in $)resulted in the following least squares line: = 80,000 + 5x.This implies that an:
(Multiple Choice)
4.8/5 (37)
Consider the following data values of variables x and y
5 4 3 6 9 8 10 7 10 5 2 3 1 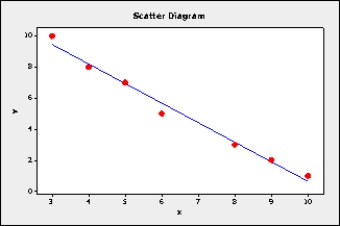 What does the scatter diagram tell you about the relationship between x and y?
(Essay)
4.8/5 (39)
In the sample regression line, what does the cap (^)over the y indicate?
(Essay)
4.9/5 (34)
Unemployed
The data below are for the number of unemployed persons (in millions)and the federal unemployment insurance payments (in billions of dollars)for the years 1978 - 1985.Some economists state that these two variables are positively related.
Year Federal Unemployment Insurance Payments 11.8 10.7 18.0 19.7 23.7 31.5 18.4 16.8 Number of Unemployed Persons 6.2 6.1 7.6 8.3 10.7 10.7 8.5 8.3
-Calculate the estimated standard deviation of the slope.
(Short Answer)
4.9/5 (41)
Unemployed
The data below are for the number of unemployed persons (in millions)and the federal unemployment insurance payments (in billions of dollars)for the years 1978 - 1985.Some economists state that these two variables are positively related.
Year Federal Unemployment Insurance Payments 11.8 10.7 18.0 19.7 23.7 31.5 18.4 16.8 Number of Unemployed Persons 6.2 6.1 7.6 8.3 10.7 10.7 8.5 8.3
-Use these data to develop a scatter diagram for these data.
(Essay)
4.8/5 (28)
Household
The following data was collected by a particular company to determine if a relationship exists between the number of people in a household and weekly food expenditures.
Househald Number in Hausehald Weakly Fadd Expenses 1 2 \ 95 2 3 \ 137 3 5 \ 165 4 2 \ 105 5 4 \ 227 6 4 \ 240 7 5 \ 185
-Construct a 95% confidence interval for the mean weekly food expense when the number in household equals 3.
(Essay)
4.9/5 (28)
Simple linear regression requires that the scales of measurement be expressed in either:
(Multiple Choice)
4.9/5 (28)
Filters
- Essay(0)
- Multiple Choice(0)
- Short Answer(0)
- True False(0)
- Matching(0)