Exam 15: Simple Linear Regression and Correlation
Exam 1: A Preview of Business Statistics55 Questions
Exam 2: Visual Description of Data67 Questions
Exam 3: Statistical Description of Data146 Questions
Exam 4: Data Collection and Sampling Methods104 Questions
Exam 5: Probability: Review of Basic Concepts188 Questions
Exam 6: Discrete Probability Distributions140 Questions
Exam 7: Continuous Probability Distributions160 Questions
Exam 8: Sampling Distributions108 Questions
Exam 9: Estimation From Sample Data150 Questions
Exam 10: Hypothesis Tests Involving a Sample Mean or Proportion170 Questions
Exam 11: Hypothesis Tests Involving Two Sample Means149 Questions
Exam 12: Analysis of Variance Tests173 Questions
Exam 13: Chi-Square Applications134 Questions
Exam 14: Nonparametric Methods139 Questions
Exam 15: Simple Linear Regression and Correlation145 Questions
Exam 16: Multiple Regression and Correlation98 Questions
Exam 17: Model Building83 Questions
Exam 18: Models for Time Series and Forecasting127 Questions
Exam 19: Decision Theory82 Questions
Exam 20: Total Quality Management132 Questions
Select questions type
Consider the following data values of variables x and y
5 4 3 6 9 8 10 7 10 5 2 3 1 Use Minitab or Excel to construct a scatter diagram of the data points and plot the least squares regression line on it.
(Essay)
4.8/5  (27)
(27)
Based on sample data,the 90% confidence interval for the slope of the population regression line is found to be from -2 to 1.Based on this information,what is the most accurate statement than can be made about the p-value in testing versus
(Essay)
4.8/5 (37)
Given the least squares regression line = -2.88 + 1.77x,and a coefficient of determination of 0.81,the coefficient of correlation is:
(Multiple Choice)
4.9/5 (36)
Unemployed
The data below are for the number of unemployed persons (in millions)and the federal unemployment insurance payments (in billions of dollars)for the years 1978 - 1985.Some economists state that these two variables are positively related.
Year Federal Unemployment Insurance Payments 11.8 10.7 18.0 19.7 23.7 31.5 18.4 16.8 Number of Unemployed Persons 6.2 6.1 7.6 8.3 10.7 10.7 8.5 8.3
-Construct a 95% confidence interval for the slope of the population regression line.
(Short Answer)
4.9/5 (35)
All of the values of an independent variable equal the same number.Regressing a dependent variable on this independent variable will result in a coefficient of determination (r 2 )of:
(Multiple Choice)
4.8/5 (30)
An indication of no linear relationship between two variables would be:
(Multiple Choice)
4.8/5 (27)
X and Y
Consider the following data values of variables x and y
x 5 4 3 6 9 8 10 y 7 8 10 5 2 3 1
-The simple linear regression equation is .what does the normal probability plot of the residuals (shown below)tell you?: 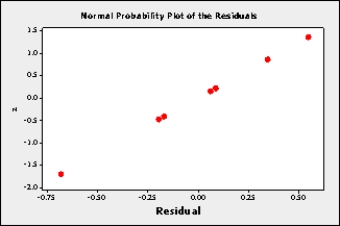
(Essay)
4.8/5 (28)
In simple linear regression,the coefficient of correlation r and the least squares estimate of the population slope :
(Multiple Choice)
4.8/5 (36)
What is the Lilliefors test,and how can it contribute to regression and correlation analysis?
(Essay)
4.7/5 (33)
For a given value of x,the estimation interval for an individual y observation is called the:
(Multiple Choice)
4.9/5 (32)
Correlation analysis provides us with two important measures of the strength: (1)the coefficient of ____________________ and (2)the coefficient of ____________________.
(Short Answer)
4.9/5 (31)
The regression line = 3 + 2x has been fitted to the data points (4,8), (2,5), and (1,2). The residual sum of squares will be:
(Multiple Choice)
4.9/5 (27)
Is it possible for the standard error of the estimate to be equal to zero? If so,under what circumstances?
(Essay)
4.7/5 (33)
Briefly describe each of the following:
A)An inverse relationship between variables __________________________________
B)A direct relationship between variables __________________________________
C)A linear relationship between variables __________________________________
D)A curvilinear relationship between variables __________________________________
(Essay)
4.8/5 (28)
Household
The following data was collected by a particular company to determine if a relationship exists between the number of people in a household and weekly food expenditures.
Househald Number in Hausehald Weakly Fadd Expenses 1 2 \ 95 2 3 \ 137 3 5 \ 165 4 2 \ 105 5 4 \ 227 6 4 \ 240 7 5 \ 185
-Identify the independent and dependent variables.
(Essay)
4.8/5 (26)
The symbol for the independent variable is ____________________ and the symbol for the dependent variable is ____________________.
(Short Answer)
4.9/5 (38)
In a regression problem,if the coefficient of determination is 0.90,this means that:
(Multiple Choice)
4.8/5 (27)
Salesperson
The general manager of a chain of furniture stores believes that experience is the most important factor in determining the level of success of a salesperson.To examine this belief she records last month's sales (in $1,000s)and the years of experience of 10 randomly selected salespeople.These data are listed below.
Ealesperson Years of Experience Eales 1 0 7 2 2 9 3 10 20 4 3 15 5 8 18 0 5 14 7 12 20 8 7 17 9 20 30 10 15 25
-Calculate the coefficient of correlation.
r = ____________________
What sign does it have? Why?
(Essay)
4.7/5 (40)
Unemployed
The data below are for the number of unemployed persons (in millions)and the federal unemployment insurance payments (in billions of dollars)for the years 1978 - 1985.Some economists state that these two variables are positively related.
Year Federal Unemployment Insurance Payments 11.8 10.7 18.0 19.7 23.7 31.5 18.4 16.8 Number of Unemployed Persons 6.2 6.1 7.6 8.3 10.7 10.7 8.5 8.3
-Assume that a simple linear regression model is appropriate for these data.Identify the dependent and independent variables.
Dependent variable Y: _______________________________
Independent variable X: ______________________________
(Short Answer)
4.9/5 (42)
Household
The following data was collected by a particular company to determine if a relationship exists between the number of people in a household and weekly food expenditures.
Househald Number in Hausehald Weakly Fadd Expenses 1 2 \ 95 2 3 \ 137 3 5 \ 165 4 2 \ 105 5 4 \ 227 6 4 \ 240 7 5 \ 185
-Calculate the coefficient of correlation and interpret the results.
(Essay)
4.8/5 (43)
Filters
- Essay(0)
- Multiple Choice(0)
- Short Answer(0)
- True False(0)
- Matching(0)