Exam 15: Simple Linear Regression and Correlation
Exam 1: A Preview of Business Statistics55 Questions
Exam 2: Visual Description of Data67 Questions
Exam 3: Statistical Description of Data146 Questions
Exam 4: Data Collection and Sampling Methods104 Questions
Exam 5: Probability: Review of Basic Concepts188 Questions
Exam 6: Discrete Probability Distributions140 Questions
Exam 7: Continuous Probability Distributions160 Questions
Exam 8: Sampling Distributions108 Questions
Exam 9: Estimation From Sample Data150 Questions
Exam 10: Hypothesis Tests Involving a Sample Mean or Proportion170 Questions
Exam 11: Hypothesis Tests Involving Two Sample Means149 Questions
Exam 12: Analysis of Variance Tests173 Questions
Exam 13: Chi-Square Applications134 Questions
Exam 14: Nonparametric Methods139 Questions
Exam 15: Simple Linear Regression and Correlation145 Questions
Exam 16: Multiple Regression and Correlation98 Questions
Exam 17: Model Building83 Questions
Exam 18: Models for Time Series and Forecasting127 Questions
Exam 19: Decision Theory82 Questions
Exam 20: Total Quality Management132 Questions
Select questions type
The variation explained by regression line is denoted by ____________________,while the variation not explained by regression line is denoted by ____________________.
(Short Answer)
4.8/5  (31)
(31)
The coefficient of correlation between variables y and x is 0.80.Calculate and interpret the value of the coefficient of determination.
(Essay)
4.8/5 (36)
What does the following scatter diagram tell you about the relationship between x and y? 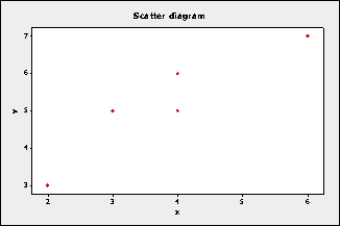
(Essay)
4.7/5 (43)
Salesperson
The general manager of a chain of furniture stores believes that experience is the most important factor in determining the level of success of a salesperson.To examine this belief she records last month's sales (in $1,000s)and the years of experience of 10 randomly selected salespeople.These data are listed below.
Ealesperson Years of Experience Eales 1 0 7 2 2 9 3 10 20 4 3 15 5 8 18 0 5 14 7 12 20 8 7 17 9 20 30 10 15 25
-Conduct a test of the population coefficient of correlation to determine at the 5% significance level whether a linear relationship exists between years of experience and sales.
(Essay)
4.8/5 (39)
For n = 37 data points,r2 = 0.49.At the 0.02 level of significance,can we conclude that the true coefficient of correlation could be zero?
(Essay)
4.7/5 (44)
Which assumptions are required in using the simple linear regression model ?
(Essay)
4.9/5 (36)
For a set of data,the total variation or sum of squares for y is SST =180,and the error sum of squares SSE =54.What proportion of the variation in y is explained by the regression equation?
(Essay)
4.9/5 (36)
Salesperson
The general manager of a chain of furniture stores believes that experience is the most important factor in determining the level of success of a salesperson.To examine this belief she records last month's sales (in $1,000s)and the years of experience of 10 randomly selected salespeople.These data are listed below.
Ealesperson Years of Experience Eales 1 0 7 2 2 9 3 10 20 4 3 15 5 8 18 0 5 14 7 12 20 8 7 17 9 20 30 10 15 25
-If the regression equation is ,compute the standardized residuals and identify possible outliers.
(Essay)
4.7/5 (32)
When the predicted values of y and the actual values of y are the same,the standard error of estimate will be 0.0.
(True/False)
5.0/5 (30)
Unemployed
The data below are for the number of unemployed persons (in millions)and the federal unemployment insurance payments (in billions of dollars)for the years 1978 - 1985.Some economists state that these two variables are positively related.
Year Federal Unemployment Insurance Payments 11.8 10.7 18.0 19.7 23.7 31.5 18.4 16.8 Number of Unemployed Persons 6.2 6.1 7.6 8.3 10.7 10.7 8.5 8.3
-Calculate the coefficient of correlation
r = ____________________
(Short Answer)
4.8/5 (34)
Salesperson
The general manager of a chain of furniture stores believes that experience is the most important factor in determining the level of success of a salesperson.To examine this belief she records last month's sales (in $1,000s)and the years of experience of 10 randomly selected salespeople.These data are listed below.
Ealesperson Years of Experience Eales 1 0 7 2 2 9 3 10 20 4 3 15 5 8 18 0 5 14 7 12 20 8 7 17 9 20 30 10 15 25
-Interpret the value of the slope of the regression line.
(Essay)
4.8/5 (33)
The coefficient of determination is a number that indicates both the direction and the strength of the linear relationship between the dependent and independent variable.
(True/False)
4.9/5 (36)
A regression analysis between sales (in $1000)and advertising (in $100)resulted in the following least squares line: = 75 +6x.This implies that if advertising is $800,then the predicted amount of sales (in dollars)is:
(Multiple Choice)
4.9/5 (34)
Number of years
Data was collected to describe the relationship between salary and number of years of working experience at a particular organization and is shown below in the following table.
Employee Salary Years af Experience 1 \ 35,000 4 2 \ 7,200 13 3 \ 45,900 6 4 \ 42,200 7 5 \ 65,600 10 6 \ 51,500 9 7 \ 57,200 5 8 \ 71,400 7
-The divisor of the standard error of estimate in simple linear regression is:
(Short Answer)
4.9/5 (34)
Used cars
The following table shows the selling prices and mileages for 7 used cars of a certain model.
Mileane Price 22,600 \ 15,200 32,100 \ 12,500 43,800 \ 13,900 51,800 \ 9500 59,400 \ 11,600 65,500 \ 11,700 74,700 \ 8900
-Identify the dependent and independent variable.
(Essay)
4.7/5 (34)
What is the standard error of estimate,and what role does it play in simple linear regression and correlation analysis?
(Essay)
5.0/5 (32)
In order to estimate with 95% confidence the expected value of y in a simple linear regression problem,a random sample of 10 observations is taken.Which of the following t-table values listed below would be used?
(Multiple Choice)
4.8/5 (29)
Number of years
Data was collected to describe the relationship between salary and number of years of working experience at a particular organization and is shown below in the following table.
Employee Salary Years af Experience 1 \ 35,000 4 2 \ 7,200 13 3 \ 45,900 6 4 \ 42,200 7 5 \ 65,600 10 6 \ 51,500 9 7 \ 57,200 5 8 \ 71,400 7
-Identify the dependent and independent variables.
(Essay)
4.8/5 (40)
Salesperson
The general manager of a chain of furniture stores believes that experience is the most important factor in determining the level of success of a salesperson.To examine this belief she records last month's sales (in $1,000s)and the years of experience of 10 randomly selected salespeople.These data are listed below.
Ealesperson Years of Experience Eales 1 0 7 2 2 9 3 10 20 4 3 15 5 8 18 0 5 14 7 12 20 8 7 17 9 20 30 10 15 25
-If the regression equation is ,plot the residuals against the predicted values of y.Does the variance appear to be constant?
(Essay)
4.9/5 (32)
Maintenance Costs
Data was collected to investigate the relationship between the age and annual maintenance costs for a one particular car.The table below shows the costs over the life of a seven-year old car.
Year Annual Maintenance Casts 1 \ 150 2 \ 210 3 \ 450 4 \ 490 5 \ 510 6 \ 1590 7 \ 160
-Determine the standard error of estimate.
(Essay)
4.8/5 (41)
Filters
- Essay(0)
- Multiple Choice(0)
- Short Answer(0)
- True False(0)
- Matching(0)