Exam 12: Simple Linear Regression
Exam 1: Data and Statistics104 Questions
Exam 2: Descriptive Statistics: Tabular and Graphical Presentations65 Questions
Exam 3: Descriptive Statistics: Numerical Measures162 Questions
Exam 4: Introduction to Probability146 Questions
Exam 5: Discrete Probability Distributions121 Questions
Exam 6: Continuous Probability Distributions165 Questions
Exam 7: Sampling and Sampling Distributions131 Questions
Exam 8: Interval Estimation131 Questions
Exam 9: Hypothesis Tests136 Questions
Exam 10: Comparisons Involving Means, Experimental Design and Analysis of Variance208 Questions
Exam 11: Comparisons Involving Proportions and a Test of Independence94 Questions
Exam 12: Simple Linear Regression140 Questions
Exam 13: Multiple Regression146 Questions
Select questions type
Exhibit 12-8
The following information regarding a dependent variable Y and an independent variable X is provided
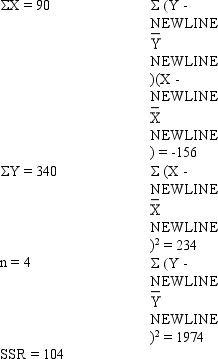 -Refer to Exhibit 12-8. The coefficient of correlation is
(Multiple Choice)
4.9/5  (37)
(37)
In simple linear regression analysis, which of the following is not true?
(Multiple Choice)
4.7/5 (38)
If the coefficient of correlation is a negative value, then the coefficient of determination
(Multiple Choice)
4.9/5 (32)
Exhibit 12-8
The following information regarding a dependent variable Y and an independent variable X is provided
-Refer to Exhibit 12-8. The sum of squares due to error (SSE) is
(Multiple Choice)
4.8/5 (36)
Exhibit 12-10
The following information regarding a dependent variable Y and an independent variable X is provided. 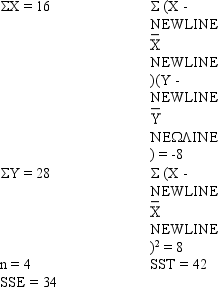 -Refer to Exhibit 12-10. The point estimate of Y when X = 3 is
(Multiple Choice)
4.8/5 (35)
The owner of a retail store randomly selected the following weekly data on profits and advertising cost.
 a.Write down the appropriate linear relationship between advertising cost and profits. Which is the dependent variable? Which is the independent variable?
b.Calculate the least squares estimated regression line.
c.Predict the profits for a week when $200 is spent on advertising.
d.At 95% confidence, test to determine if the relationship between advertising costs and profits is statistically significant.
e.Calculate the coefficient of determination.
a.Write down the appropriate linear relationship between advertising cost and profits. Which is the dependent variable? Which is the independent variable?
b.Calculate the least squares estimated regression line.
c.Predict the profits for a week when $200 is spent on advertising.
d.At 95% confidence, test to determine if the relationship between advertising costs and profits is statistically significant.
e.Calculate the coefficient of determination.
(Essay)
5.0/5 (36)
If a data set has SSR = 400 and SSE = 100, then the coefficient of determination is
(Multiple Choice)
4.7/5 (38)
Assume you have noted the following prices for books and the number of pages that each book contains.
 a.Perform an F test and determine if the price and the number of pages of the books are related. Let = 0.01.
b.Perform a t test and determine if the price and the number of pages of the books are related. Let = 0.01.
c.Develop a 90% confidence interval for estimating the average price of books that contain 800 pages.
d.Develop a 90% confidence interval to estimate the price of a specific book that has 800 pages.
a.Perform an F test and determine if the price and the number of pages of the books are related. Let = 0.01.
b.Perform a t test and determine if the price and the number of pages of the books are related. Let = 0.01.
c.Develop a 90% confidence interval for estimating the average price of books that contain 800 pages.
d.Develop a 90% confidence interval to estimate the price of a specific book that has 800 pages.
(Essay)
4.9/5 (39)
Exhibit 12-6
For the following data the value of SSE = 0.4130.
 -Refer to Exhibit 12-6. The coefficient of determination (r2) equals
(Multiple Choice)
4.8/5 (26)
Exhibit 12-2
You are given the following information about y and x.
 -Refer to Exhibit 12-2. The sample correlation coefficient equals
(Multiple Choice)
4.8/5 (40)
Exhibit 12-1
The following information regarding a dependent variable (Y) and an independent variable (X) is provided.  SSE = 6
SST = 16
-Refer to Exhibit 12-1. The least squares estimate of the slope is
SSE = 6
SST = 16
-Refer to Exhibit 12-1. The least squares estimate of the slope is
(Multiple Choice)
4.8/5 (29)
If two variables, x and y, have a strong linear relationship, then
(Multiple Choice)
4.8/5 (35)
Shown below is a portion of a computer output for a regression analysis relating Y (demand) and X (unit price).
 a.Perform a t test and determine whether or not demand and unit price are related. Let = 0.05.
b.Perform an F test and determine whether or not demand and unit price are related. Let = 0.05.
c.Compute the coefficient of determination and fully interpret its meaning. Be very specific.
d.Compute the coefficient of correlation and explain the relationship between demand and unit price.
a.Perform a t test and determine whether or not demand and unit price are related. Let = 0.05.
b.Perform an F test and determine whether or not demand and unit price are related. Let = 0.05.
c.Compute the coefficient of determination and fully interpret its meaning. Be very specific.
d.Compute the coefficient of correlation and explain the relationship between demand and unit price.
(Essay)
4.8/5 (26)
Exhibit 12-5
The following information regarding a dependent variable (Y) and an independent variable (X) is provided.  -Refer to Exhibit 12-5. The MSE is
(Multiple Choice)
4.8/5 (36)
Exhibit 12-9
A regression and correlation analysis resulted in the following information regarding a dependent variable (y) and an independent variable (x).
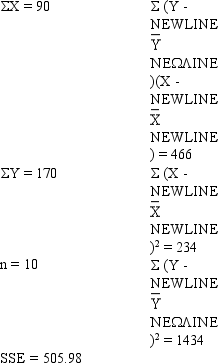 -Refer to Exhibit 12-9. The coefficient of determination equals
(Multiple Choice)
4.9/5 (37)
The following data shows the yearly income (in $1,000) and age of a sample of seven individuals.
 a.Develop the least squares regression equation.
b.Estimate the yearly income of a 30-year-old individual.
c.Compute the coefficient of determination.
d.Use a t test to determine whether the slope is significantly different from zero. Let = 0.05.
e.At 95% confidence, perform an F test and determine whether or not the model is significant.
a.Develop the least squares regression equation.
b.Estimate the yearly income of a 30-year-old individual.
c.Compute the coefficient of determination.
d.Use a t test to determine whether the slope is significantly different from zero. Let = 0.05.
e.At 95% confidence, perform an F test and determine whether or not the model is significant.
(Essay)
4.9/5 (31)
Exhibit 12-7
You are given the following information about y and x.
 -Refer to Exhibit 12-7. The least squares estimate of b0 (intercept) equals
(Multiple Choice)
4.9/5 (29)
Filters
- Essay(0)
- Multiple Choice(0)
- Short Answer(0)
- True False(0)
- Matching(0)