Exam 12: Simple Linear Regression
Exam 1: Data and Statistics104 Questions
Exam 2: Descriptive Statistics: Tabular and Graphical Presentations65 Questions
Exam 3: Descriptive Statistics: Numerical Measures162 Questions
Exam 4: Introduction to Probability146 Questions
Exam 5: Discrete Probability Distributions121 Questions
Exam 6: Continuous Probability Distributions165 Questions
Exam 7: Sampling and Sampling Distributions131 Questions
Exam 8: Interval Estimation131 Questions
Exam 9: Hypothesis Tests136 Questions
Exam 10: Comparisons Involving Means, Experimental Design and Analysis of Variance208 Questions
Exam 11: Comparisons Involving Proportions and a Test of Independence94 Questions
Exam 12: Simple Linear Regression140 Questions
Exam 13: Multiple Regression146 Questions
Select questions type
Exhibit 12-8
The following information regarding a dependent variable Y and an independent variable X is provided
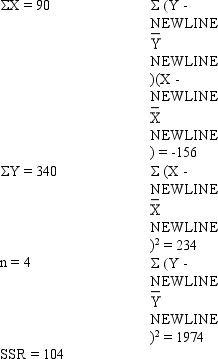 -Refer to Exhibit 12-8. The mean square error (MSE) is
(Multiple Choice)
4.8/5  (34)
(34)
Exhibit 12-5
The following information regarding a dependent variable (Y) and an independent variable (X) is provided.  -Refer to Exhibit 12-5. The least squares estimate of the Y intercept is
(Multiple Choice)
4.8/5 (38)
In a regression analysis if SSE = 200 and SSR = 300, then the coefficient of determination is
(Multiple Choice)
4.8/5 (33)
Regression analysis was applied between demand for a product (Y) and the price of the product (X), and the following estimated regression equation was obtained. = 120 - 10 X
Based on the above estimated regression equation, if price is increased by 2 units, then demand is expected to
= 120 - 10 X
Based on the above estimated regression equation, if price is increased by 2 units, then demand is expected to
(Multiple Choice)
4.7/5 (33)
Exhibit 12-1
The following information regarding a dependent variable (Y) and an independent variable (X) is provided.  SSE = 6
SST = 16
-Refer to Exhibit 12-1. The coefficient of determination is
SSE = 6
SST = 16
-Refer to Exhibit 12-1. The coefficient of determination is
(Multiple Choice)
4.8/5 (28)
Exhibit 12-6
For the following data the value of SSE = 0.4130.
 -Refer to Exhibit 12-6. The slope of the regression equation is
(Multiple Choice)
4.8/5 (26)
In regression analysis, if the independent variable is measured in pounds, the dependent variable
(Multiple Choice)
4.8/5 (29)
A regression analysis between sales (in $1000) and price (in dollars) resulted in the following equation  = 60 - 8X
The above equation implies that an
= 60 - 8X
The above equation implies that an
(Multiple Choice)
4.8/5 (36)
Exhibit 12-3
You are given the following information about y and x.
 -Refer to Exhibit 12-3. The coefficient of determination equals
(Multiple Choice)
4.8/5 (31)
Exhibit 12-3
You are given the following information about y and x.
-Refer to Exhibit 12-3. The least squares estimate of b1 equals
(Multiple Choice)
4.9/5 (37)
Exhibit 12-1
The following information regarding a dependent variable (Y) and an independent variable (X) is provided. SSE = 6
SST = 16
-Refer to Exhibit 12-1. The coefficient of correlation is
(Multiple Choice)
4.8/5 (34)
The owner of a bakery wants to analyze the relationship between the expenditure of a customer and the customer's income. A sample of 5 customers is taken and the following information was obtained.  The least squares estimated line is
  = 4.348 + 0.0826 X.
a.Obtain a measure of how well the estimated regression line fits the data.
b.You want to test to see if there is a significant relationship between expenditure and income at the 5% level of significance. Be sure to state the null and alternative hypotheses.
c.Construct a 95% confidence interval estimate for the average expenditure for all customers with an income of $20,000.
d.Construct a 95% confidence interval estimate for the expenditure of one customer whose income is $20,000.
= 4.348 + 0.0826 X.
a.Obtain a measure of how well the estimated regression line fits the data.
b.You want to test to see if there is a significant relationship between expenditure and income at the 5% level of significance. Be sure to state the null and alternative hypotheses.
c.Construct a 95% confidence interval estimate for the average expenditure for all customers with an income of $20,000.
d.Construct a 95% confidence interval estimate for the expenditure of one customer whose income is $20,000.
(Essay)
4.8/5 (36)
Exhibit 12-10
The following information regarding a dependent variable Y and an independent variable X is provided. 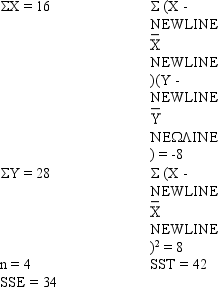 -Refer to Exhibit 12-10. The MSE is
(Multiple Choice)
4.7/5 (25)
In regression analysis, the variable that is being predicted is the
(Multiple Choice)
4.8/5 (18)
A regression analysis between sales (Y in $1000) and advertising (X in dollars) resulted in the following equation  = 30,000 + 4 X
The above equation implies that an
= 30,000 + 4 X
The above equation implies that an
(Multiple Choice)
4.9/5 (37)
Below you are given a partial computer output based on a sample of 14 observations, relating an independent variable (x) and a dependent variable (y).

 a.Develop the estimated regression line.
b.At = 0.05, test for the significance of the slope.
c.At = 0.05, perform an F test.
d.Determine the coefficient of determination.
e.
Determine the coefficient of correlation.
a.Develop the estimated regression line.
b.At = 0.05, test for the significance of the slope.
c.At = 0.05, perform an F test.
d.Determine the coefficient of determination.
e.
Determine the coefficient of correlation.
(Essay)
4.9/5 (30)
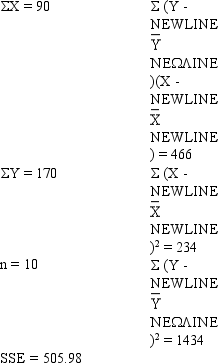
Exhibit 12-10
The following information regarding a dependent variable Y and an independent variable X is provided.
-Refer to Exhibit 12-10. The coefficient of correlation is
(Multiple Choice)
4.8/5 (36)
Part of an Excel output relating X (independent variable) and Y (dependent variable) is shown below. Fill in all the blanks marked with "?".


(Essay)
4.9/5 (39)
Exhibit 12-9
A regression and correlation analysis resulted in the following information regarding a dependent variable (y) and an independent variable (x).
 -Refer to Exhibit 12-9. The sample correlation coefficient equals
(Multiple Choice)
4.7/5 (41)
Filters
- Essay(0)
- Multiple Choice(0)
- Short Answer(0)
- True False(0)
- Matching(0)