Exam 12: Simple Linear Regression
Exam 1: Data and Statistics104 Questions
Exam 2: Descriptive Statistics: Tabular and Graphical Presentations65 Questions
Exam 3: Descriptive Statistics: Numerical Measures162 Questions
Exam 4: Introduction to Probability146 Questions
Exam 5: Discrete Probability Distributions121 Questions
Exam 6: Continuous Probability Distributions165 Questions
Exam 7: Sampling and Sampling Distributions131 Questions
Exam 8: Interval Estimation131 Questions
Exam 9: Hypothesis Tests136 Questions
Exam 10: Comparisons Involving Means, Experimental Design and Analysis of Variance208 Questions
Exam 11: Comparisons Involving Proportions and a Test of Independence94 Questions
Exam 12: Simple Linear Regression140 Questions
Exam 13: Multiple Regression146 Questions
Select questions type
If the coefficient of correlation is 0.8, the percentage of variation in the dependent variable explained by the variation in the independent variable is
(Multiple Choice)
5.0/5  (34)
(34)
In regression and correlation analysis, if SSE and SST are known, then with this information the
(Multiple Choice)
4.8/5 (28)
In a regression analysis, the coefficient of correlation is 0.16. The coefficient of determination in this situation is
(Multiple Choice)
4.8/5 (32)
Below you are given a partial computer output based on a sample of 8 observations, relating an independent variable (x) and a dependent variable (y).

 a.Develop the estimated regression line.
b.At = 0.05, test for the significance of the slope.
c.At = 0.05, perform an F test.
d.Determine the coefficient of determination.
a.Develop the estimated regression line.
b.At = 0.05, test for the significance of the slope.
c.At = 0.05, perform an F test.
d.Determine the coefficient of determination.
(Essay)
4.8/5 (40)
In a regression analysis if SST = 500 and SSE = 300, then the coefficient of determination is
(Multiple Choice)
4.9/5 (46)
A regression and correlation analysis resulted in the following information regarding an independent variable (x) and a dependent variable (y).
 a.Develop the least squares estimated regression equation.
b.At 95% confidence, perform a t test and determine whether or not the slope is significantly different from zero.
c.Perform an F test to determine whether or not the model is significant. Let = 0.05.
d.Compute the coefficient of determination.
a.Develop the least squares estimated regression equation.
b.At 95% confidence, perform a t test and determine whether or not the slope is significantly different from zero.
c.Perform an F test to determine whether or not the model is significant. Let = 0.05.
d.Compute the coefficient of determination.
(Essay)
4.8/5 (26)
Shown below is a portion of a computer output for a regression analysis relating Y (dependent variable) and X (independent variable).
 a.Perform a t test using the p-value approach and determine whether or not Y and X are related. Let = 0.05.
b.Using the p-value approach, perform an F test and determine whether or not X and Y are related.
c.Compute the coefficient of determination and fully interpret its meaning. Be very specific.
a.Perform a t test using the p-value approach and determine whether or not Y and X are related. Let = 0.05.
b.Using the p-value approach, perform an F test and determine whether or not X and Y are related.
c.Compute the coefficient of determination and fully interpret its meaning. Be very specific.
(Essay)
4.7/5 (37)
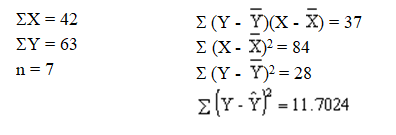
Exhibit 12-2
You are given the following information about y and x.
 -Refer to Exhibit 12-2. The coefficient of determination equals
(Multiple Choice)
4.8/5 (33)
Researchers have collected data on the hours of television watched in a day and the age of a person. You are given the data below.
 a.Determine which variable is the dependent variable.
b.Compute the least squares estimated line.
c.Is there a significant relationship between the two variables? Use a .05 level of significance. Be sure to state the null and alternative hypotheses.
d.Compute the coefficient of determination. How would you interpret this value?
a.Determine which variable is the dependent variable.
b.Compute the least squares estimated line.
c.Is there a significant relationship between the two variables? Use a .05 level of significance. Be sure to state the null and alternative hypotheses.
d.Compute the coefficient of determination. How would you interpret this value?
(Essay)
4.8/5 (39)
Given below are five observations collected in a regression study on two variables, x (independent variable) and y (dependent variable).
 a.Develop the least squares estimated regression equation.
b.At 95% confidence, perform a t test and determine whether or not the slope is significantly different from zero.
c.Perform an F test to determine whether or not the model is significant. Let = 0.05.
d.Compute the coefficient of determination.
e.
Compute the coefficient of correlation.
a.Develop the least squares estimated regression equation.
b.At 95% confidence, perform a t test and determine whether or not the slope is significantly different from zero.
c.Perform an F test to determine whether or not the model is significant. Let = 0.05.
d.Compute the coefficient of determination.
e.
Compute the coefficient of correlation.
(Essay)
4.8/5 (39)
In a regression analysis, the regression equation is given by y = 12 - 6x. If SSE = 510 and SST = 1000, then the coefficient of correlation is
(Multiple Choice)
4.9/5 (40)
Exhibit 12-7
You are given the following information about y and x.
 -Refer to Exhibit 12-7. The least squares estimate of b1 (slope) equals
(Multiple Choice)
4.8/5 (35)
Exhibit 12-1
The following information regarding a dependent variable (Y) and an independent variable (X) is provided.  SSE = 6
SST = 16
-Refer to Exhibit 12-1. The least squares estimate of the Y intercept is
SSE = 6
SST = 16
-Refer to Exhibit 12-1. The least squares estimate of the Y intercept is
(Multiple Choice)
4.9/5 (27)
The equation that describes how the dependent variable (y) is related to the independent variable (x) is called
(Multiple Choice)
4.7/5 (35)
Exhibit 12-7
You are given the following information about y and x.
-Refer to Exhibit 12-7. The coefficient of determination equals
(Multiple Choice)
4.8/5 (37)
Exhibit 12-4
Regression analysis was applied between sales data (Y in $1,000s) and advertising data (x in $100s) and the following information was obtained.
 = 12 + 1.8 x
n = 17
SSR = 225
SSE = 75
Sb1 = 0.2683
-Refer to Exhibit 12-4. Based on the above estimated regression equation, if advertising is $3,000, then the point estimate for sales (in dollars) is
= 12 + 1.8 x
n = 17
SSR = 225
SSE = 75
Sb1 = 0.2683
-Refer to Exhibit 12-4. Based on the above estimated regression equation, if advertising is $3,000, then the point estimate for sales (in dollars) is
(Multiple Choice)
4.7/5 (37)
Filters
- Essay(0)
- Multiple Choice(0)
- Short Answer(0)
- True False(0)
- Matching(0)