Exam 12: Simple Linear Regression
Exam 1: Data and Statistics104 Questions
Exam 2: Descriptive Statistics: Tabular and Graphical Presentations65 Questions
Exam 3: Descriptive Statistics: Numerical Measures162 Questions
Exam 4: Introduction to Probability146 Questions
Exam 5: Discrete Probability Distributions121 Questions
Exam 6: Continuous Probability Distributions165 Questions
Exam 7: Sampling and Sampling Distributions131 Questions
Exam 8: Interval Estimation131 Questions
Exam 9: Hypothesis Tests136 Questions
Exam 10: Comparisons Involving Means, Experimental Design and Analysis of Variance208 Questions
Exam 11: Comparisons Involving Proportions and a Test of Independence94 Questions
Exam 12: Simple Linear Regression140 Questions
Exam 13: Multiple Regression146 Questions
Select questions type
In a regression analysis, the error term is a random variable with a mean or expected value of
(Multiple Choice)
4.8/5  (35)
(35)
In a regression analysis the standard error is determined to be 4. In this situation the MSE
(Multiple Choice)
4.7/5 (38)
Exhibit 12-8
The following information regarding a dependent variable Y and an independent variable X is provided
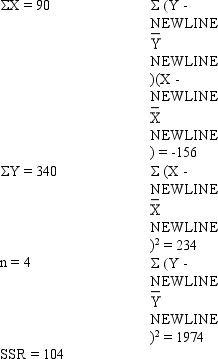 -Refer to Exhibit 12-8. The total sum of squares (SST) is
(Multiple Choice)
4.7/5 (24)
Given below are five observations collected in a regression study on two variables x (independent variable) and y (dependent variable).
 a.Develop the least squares estimated regression equation
b.At 95% confidence, perform a t test and determine whether or not the slope is significantly different from zero.
c.Perform an F test to determine whether or not the model is significant. Let = 0.05.
d.Compute the coefficient of determination.
e.
Compute the coefficient of correlation.
a.Develop the least squares estimated regression equation
b.At 95% confidence, perform a t test and determine whether or not the slope is significantly different from zero.
c.Perform an F test to determine whether or not the model is significant. Let = 0.05.
d.Compute the coefficient of determination.
e.
Compute the coefficient of correlation.
(Essay)
4.7/5 (38)
Exhibit 12-6
For the following data the value of SSE = 0.4130.
 -Refer to Exhibit 12-6. The y intercept is
(Multiple Choice)
4.9/5 (40)
The model developed from sample data that has the form of  is known as
(Multiple Choice)
4.7/5 (32)
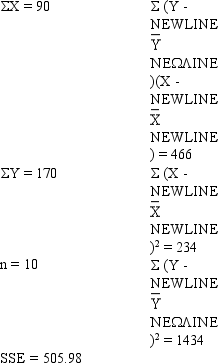
Exhibit 12-10
The following information regarding a dependent variable Y and an independent variable X is provided. 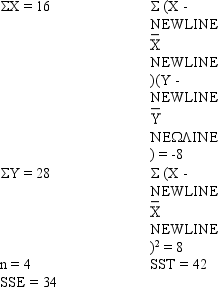 -Refer to Exhibit 12-10. The Y intercept is
(Multiple Choice)
4.9/5 (29)
Exhibit 12-5
The following information regarding a dependent variable (Y) and an independent variable (X) is provided.  -Refer to Exhibit 12-5. The least squares estimate of the slope is
(Multiple Choice)
4.9/5 (25)
In regression analysis if the dependent variable is measured in dollars, the independent variable
(Multiple Choice)
5.0/5 (36)
Exhibit 12-10
The following information regarding a dependent variable Y and an independent variable X is provided.
-Refer to Exhibit 12-10. The slope of the regression function is
(Multiple Choice)
4.9/5 (43)
In regression analysis, the unbiased estimate of the variance is
(Multiple Choice)
4.7/5 (38)
In a regression analysis if SST = 4500 and SSE = 1575, then the coefficient of determination is
(Multiple Choice)
4.7/5 (37)
Larger values of r2 imply that the observations are more closely grouped about the
(Multiple Choice)
4.9/5 (39)
The following data show the results of an aptitude test (Y) and the grade point average of 10 students.
 a.Develop a least squares estimated regression line.
b.Compute the coefficient of determination and comment on the strength of the regression relationship.
c.Is the slope significant? Use a t test and let = 0.05.
d.At 95% confidence, test to determine if the model is significant (i.e., perform an F test).
a.Develop a least squares estimated regression line.
b.Compute the coefficient of determination and comment on the strength of the regression relationship.
c.Is the slope significant? Use a t test and let = 0.05.
d.At 95% confidence, test to determine if the model is significant (i.e., perform an F test).
(Essay)
4.8/5 (37)
Given below are seven observations collected in a regression study on two variables, X (independent variable) and Y (dependent variable).
 a.Develop the least squares estimated regression equation.
b.At 95% confidence, perform a t test and determine whether or not the slope is significantly different from zero.
c.Perform an F test to determine whether or not the model is significant. Let = 0.05.
d.Compute the coefficient of determination.
a.Develop the least squares estimated regression equation.
b.At 95% confidence, perform a t test and determine whether or not the slope is significantly different from zero.
c.Perform an F test to determine whether or not the model is significant. Let = 0.05.
d.Compute the coefficient of determination.
(Essay)
4.7/5 (33)
If the coefficient of determination is equal to 1, then the coefficient of correlation
(Multiple Choice)
4.8/5 (30)
In a regression analysis, the variable that is being predicted
(Multiple Choice)
4.8/5 (32)
Exhibit 12-4
Regression analysis was applied between sales data (Y in $1,000s) and advertising data (x in $100s) and the following information was obtained.
 = 12 + 1.8 x
n = 17
SSR = 225
SSE = 75
Sb1 = 0.2683
-Refer to Exhibit 12-4. The F statistic computed from the above data is
= 12 + 1.8 x
n = 17
SSR = 225
SSE = 75
Sb1 = 0.2683
-Refer to Exhibit 12-4. The F statistic computed from the above data is
(Multiple Choice)
4.8/5 (38)
Exhibit 12-9
A regression and correlation analysis resulted in the following information regarding a dependent variable (y) and an independent variable (x).
 -Refer to Exhibit 12-9. The sum of squares due to regression (SSR) is
(Multiple Choice)
4.7/5 (46)
Filters
- Essay(0)
- Multiple Choice(0)
- Short Answer(0)
- True False(0)
- Matching(0)