Exam 12: Simple Linear Regression
Exam 1: Data and Statistics104 Questions
Exam 2: Descriptive Statistics: Tabular and Graphical Presentations65 Questions
Exam 3: Descriptive Statistics: Numerical Measures162 Questions
Exam 4: Introduction to Probability146 Questions
Exam 5: Discrete Probability Distributions121 Questions
Exam 6: Continuous Probability Distributions165 Questions
Exam 7: Sampling and Sampling Distributions131 Questions
Exam 8: Interval Estimation131 Questions
Exam 9: Hypothesis Tests136 Questions
Exam 10: Comparisons Involving Means, Experimental Design and Analysis of Variance208 Questions
Exam 11: Comparisons Involving Proportions and a Test of Independence94 Questions
Exam 12: Simple Linear Regression140 Questions
Exam 13: Multiple Regression146 Questions
Select questions type
Exhibit 12-6
For the following data the value of SSE = 0.4130.
 -Refer to Exhibit 12-6. The total sum of squares (SST) equals
(Multiple Choice)
4.8/5  (35)
(35)
Exhibit 12-10
The following information regarding a dependent variable Y and an independent variable X is provided. 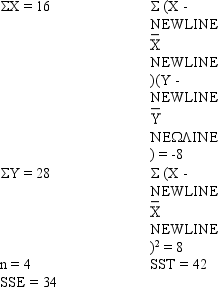 -Refer to Exhibit 12-10. The coefficient of determination is
(Multiple Choice)
4.9/5 (37)
Exhibit 12-3
You are given the following information about y and x.
 -Refer to Exhibit 12-3. The least squares estimate of b0 equals
(Multiple Choice)
4.8/5 (31)
In a simple regression analysis (where Y is a dependent and X an independent variable), if the Y intercept is positive, then
(Multiple Choice)
4.8/5 (32)
Below you are given information on a woman's age and her annual expenditure on purchase of books.
 a.Develop the least squares regression equation.
b.Compute the coefficient of determination.
c.Use a t test to determine whether the slope is significantly different from zero. Let = 0.05.
d.At 95% confidence, perform an F test and determine whether or not the model is significant.
a.Develop the least squares regression equation.
b.Compute the coefficient of determination.
c.Use a t test to determine whether the slope is significantly different from zero. Let = 0.05.
d.At 95% confidence, perform an F test and determine whether or not the model is significant.
(Essay)
4.9/5 (36)
The interval estimate of an individual value of y for a given value of x is
(Multiple Choice)
4.9/5 (28)
If the coefficient of correlation is a positive value, then the regression equation
(Multiple Choice)
4.8/5 (26)
An automobile dealer wants to see if there is a relationship between monthly sales and the interest rate. A random sample of 4 months was taken. The results of the sample are presented below. The estimated least squares regression equation is  = 75.061 - 6.254X
 a.Obtain a measure of how well the estimated regression line fits the data.
b.You want to test to see if there is a significant relationship between the interest rate and monthly sales at the 1% level of significance. State the null and alternative hypotheses.
c.At 99% confidence, test the hypotheses.
d.Construct a 99% confidence interval for the average monthly sales for all months with a 10% interest rate.
e.
Construct a 99% confidence interval for the monthly sales of one month with a 10% interest rate.
a.Obtain a measure of how well the estimated regression line fits the data.
b.You want to test to see if there is a significant relationship between the interest rate and monthly sales at the 1% level of significance. State the null and alternative hypotheses.
c.At 99% confidence, test the hypotheses.
d.Construct a 99% confidence interval for the average monthly sales for all months with a 10% interest rate.
e.
Construct a 99% confidence interval for the monthly sales of one month with a 10% interest rate.
(Essay)
4.8/5 (27)
Regression analysis was applied between sales (Y in $1,000) and advertising (X in $100), and the following estimated regression equation was obtained. = 80 + 6.2 X
Based on the above estimated regression line, if advertising is $10,000, then the point estimate for sales (in dollars) is
= 80 + 6.2 X
Based on the above estimated regression line, if advertising is $10,000, then the point estimate for sales (in dollars) is
(Multiple Choice)
4.9/5 (38)
In a regression analysis, the coefficient of determination is 0.4225. The coefficient of correlation in this situation is
(Multiple Choice)
4.9/5 (33)
If the coefficient of determination is 0.9, the percentage of variation in the dependent variable explained by the variation in the independent variable
(Multiple Choice)
4.8/5 (47)
The following data represent the number of flash drives sold per day at a local computer shop and their prices.
 a.Develop a least-squares regression line and explain what the slope of the line indicates.
b.Compute the coefficient of determination and comment on the strength of relationship between x and y.
c.Compute the sample correlation coefficient between the price and the number of flash drives sold. Use = 0.01 to test the relationship between x and y.
a.Develop a least-squares regression line and explain what the slope of the line indicates.
b.Compute the coefficient of determination and comment on the strength of relationship between x and y.
c.Compute the sample correlation coefficient between the price and the number of flash drives sold. Use = 0.01 to test the relationship between x and y.
(Essay)
4.8/5 (31)
The mathematical equation relating the independent variable to the expected value of the dependent variable; that is, E(y) = 0 + 1x, is known as
(Multiple Choice)
4.8/5 (34)
A regression analysis between demand (Y in 1000 units) and price (X in dollars) resulted in the following equation  = 9 - 3X
The above equation implies that if the price is increased by $1, the demand is expected to
= 9 - 3X
The above equation implies that if the price is increased by $1, the demand is expected to
(Multiple Choice)
4.8/5 (35)
Jason believes that the sales of coffee at his coffee shop depend upon the weather. He has taken a sample of 6 days. Below you are given the results of the sample.
 a.Which variable is the dependent variable?
b.Compute the least squares estimated line.
c.Compute the correlation coefficient between temperature and the sales of coffee.
d.Is there a significant relationship between the sales of coffee and temperature? Use a .05 level of significance. Be sure to state the null and alternative hypotheses.
e.
Predict sales of a 90 degree day.
a.Which variable is the dependent variable?
b.Compute the least squares estimated line.
c.Compute the correlation coefficient between temperature and the sales of coffee.
d.Is there a significant relationship between the sales of coffee and temperature? Use a .05 level of significance. Be sure to state the null and alternative hypotheses.
e.
Predict sales of a 90 degree day.
(Essay)
4.8/5 (28)
A company has recorded data on the daily demand for its product (Y in thousands of units) and the unit price (X in hundreds of dollars). A sample of 15 days demand and associated prices resulted in the following data. 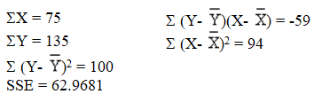 a.Using the above information, develop the least-squares estimated regression line and write the equation.
b.Compute the coefficient of determination.
c.Perform an F test and determine whether or not there is a significant relationship between demand and unit price. Let = 0.05.
d.Would the demand ever reach zero? If yes, at what price would the demand be zero?
a.Using the above information, develop the least-squares estimated regression line and write the equation.
b.Compute the coefficient of determination.
c.Perform an F test and determine whether or not there is a significant relationship between demand and unit price. Let = 0.05.
d.Would the demand ever reach zero? If yes, at what price would the demand be zero?
(Essay)
4.9/5 (37)
Exhibit 12-8
The following information regarding a dependent variable Y and an independent variable X is provided
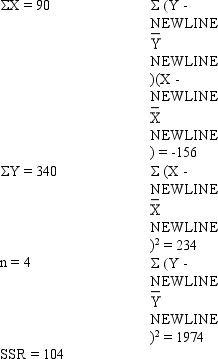 -Refer to Exhibit 12-8. The slope of the regression equation is
(Multiple Choice)
4.7/5 (37)
The following data represent the number of flash drives sold per day at a local computer shop and their prices.
 a.Perform an F test and determine if the price and the number of flash drives sold are related. Let = 0.01.
b.Perform a t test and determine if the price and the number of flash drives sold are related. Let = 0.01.
a.Perform an F test and determine if the price and the number of flash drives sold are related. Let = 0.01.
b.Perform a t test and determine if the price and the number of flash drives sold are related. Let = 0.01.
(Essay)
4.7/5 (34)
Filters
- Essay(0)
- Multiple Choice(0)
- Short Answer(0)
- True False(0)
- Matching(0)