Exam 5: The Genetics of Bacteria and Their Viruses
Exam 1: The Genetics Revolution22 Questions
Exam 2: Single-Gene Inheritance51 Questions
Exam 3: Independent Assortment of Genes55 Questions
Exam 4: Mapping Eukaryote Chromosomes by Recombination64 Questions
Exam 5: The Genetics of Bacteria and Their Viruses44 Questions
Exam 6: Gene Interaction47 Questions
Exam 7: Dna: Structure and Replication50 Questions
Exam 8: Rna: Transcription and Processing53 Questions
Exam 9: Proteins and Their Synthesis53 Questions
Exam 10: Gene Isolation and Manipulation55 Questions
Exam 11: Regulation of Gene Expression in Bacteria and Their Viruses56 Questions
Exam 12: Regulation of Gene Expression in Eukaryotes46 Questions
Exam 13: The Genetic Control of Development36 Questions
Exam 14: Genomes and Genomics26 Questions
Exam 15: The Dynamic Genome: Transposable Elements32 Questions
Exam 16: Mutation, Repair, and Recombination53 Questions
Exam 17: Large-Scale Chromosomal Changes50 Questions
Exam 18: Population Genetics48 Questions
Exam 19: The Inheritance of Complex Traits36 Questions
Exam 20: Evolution of Genes and Traits54 Questions
Select questions type
If two markers are closely linked,they will show:
Free
(Multiple Choice)
4.8/5  (35)
(35)
Correct Answer: Verified
C
To demonstrate linkage of two markers A and B by transformation,one needs to demonstrate that the frequency of transformation by:
Free
(Multiple Choice)
4.9/5 (25)
Correct Answer:Verified
A
A strain of E.coli has the genotype (and phenotype)leu- lac-.This notation means that this strain if bacteria is unable to:
Free
(Multiple Choice)
4.9/5 (41)
Correct Answer:Verified
D
A bacterial chromosome has four markers,A,B,C,and D,evenly spaced throughout the circle.A generalized transducing phage will:
(Multiple Choice)
4.8/5 (40)
The most commonly used phage characters in the study of phage inheritance are:
(Multiple Choice)
4.9/5 (38)
A cross is made between an Hfr strain that is StrSa+b+d+ in genotype and an F- strain that is StrRa-b-d- in genotype.Interrupted-mating studies show that b+ enters the recipient strain last,and that the Str locus is very far away from b+,so it never enters the recipient strain.The b+ recombinants are then tested for the presence of the a+ and d+ alleles.The following data were obtained: 326 2 14 400
a)What is the gene order?
(Multiple Choice)
4.8/5 (37)
An E.coli F- strain has the following genotype: S-U-R-I-E-C-.Three different Hfr strains,all carrying S+U+R+I+E+ and C+ markers and all having lambda phages integrated at the same specific site in their chromosomes are mated with the F strain in separate matings.The interrupted-mating results are given below.The numbers indicate time (in minutes)when different donor markers appeared in F- cells after conjugation began.Assume that the E.coli map consists of 100 minutes,and gene C is mapped at 80 minutes.
Marker'S Hfr 1 Hfr 2 Hfr 3 R 10 20 - I 40 - 5 U 25 5 - E - 60 - C - 45 - S 55 - 20
The positions of Hfr 2,the gene C,and the polarity of Hfr 2 are given in the accompanying map. 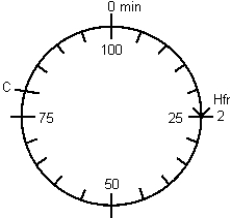 a)Give the gene order,starting from C and going clockwise.
b)What is the location of the origin of Hfr 1? Hfr 3?
c)What is the location of the I marker? The S marker?
d)What is the location of the lambda phage in these strains?
a)Give the gene order,starting from C and going clockwise.
b)What is the location of the origin of Hfr 1? Hfr 3?
c)What is the location of the I marker? The S marker?
d)What is the location of the lambda phage in these strains?
(Essay)
4.9/5 (31)
A strain of E.coli with the genotype arg-bio-gal-TetR is able to grow on minimal medium (containing glucose as a carbon source)supplemented with:
(Multiple Choice)
4.8/5 (30)
In a transformation experiment,DNA of a p+q+ strain was used to transform a recipient strain that is auxotrophic for these markers.The number of each class of transformants is shown below:
Class Genotype Number 1 405 2 300 3 195
a)If the total number of transformants isolated was 900,what is the co-transformation frequency for the p and q loci?
b)Use diagrams to show how each class of transformants were obtained starting with the recipient auxotroph.
(Essay)
4.9/5 (37)
Auxotrophic mutations have been extremely useful to study a number of processes in E.coli.
a)Briefly define the term "auxotrophic."
b)Suppose you were given two unlabeled tubes,one that contains a methionine auxotroph and the other that contains a leucine auxotroph.Design an experiment to determine which auxotroph is found in each tube.
(Essay)
4.9/5 (26)
The following table contains statements pertaining to Hfr,F+,F?,and/or F- strains of bacteria.Indicate in respective boxes if the statements apply to each category by inserting a check mark (√).
Statement Hfr a) Contains genes that regulate conjugation and the transfer of DNA from one cell to another. b) Always acts as the recipient in conjugation. c) F factor is inteprated into the host chromosone. d) Carmot forn a pilus. e) F factor is in the plasnid form carrying a segrnent of dhromosornal DNA
(Essay)
5.0/5 (41)
A mixed infection of an E.coli strain was performed using the h-r+ and h+r- genotypes of the T2 phage.Progeny phage were collected after lysis and plated on two E.coli strains to obtain plaque characters important for detection of parental and recombinant types.
h+ can only infect one strain of E.coli
h- can infect both strains
r+ shows slower lysis,forms small plaques
r- shows rapid lysis
In the table below,for each observed phenotype,give the genotype that would produce that phenotype,and indicate if the phenotype is parental or recombinant type.Calculate the map distance between the h and r genes using the information provided.
Plaque phenotype Number of plaques Plaque genotype Parental/recombinant cloudy, large 600 clear, small 480 cloudy, small 180 clear, large 180
(Essay)
4.9/5 (33)
A transduction experiment was conducted using a prototrophic donor and a recipient that was auxotrophic for lys,arg,and trp.Selection was done for trp+ transductants.The trp+ transductants could be categorized into the following classes:
Genotype Number artr 10 art 13 artr 82 artr 1
a)Which marker is closest to trp? Explain your reasoning.
b)What is the order of the three markers? Explain your reasoning.
(Essay)
4.8/5 (30)
At time zero,an Hfr strain (strain 1)was mixed with an F- strain,and at various times after mixing,samples were removed and agitated to separate conjugating cells.The cross may be written as:
HFr 1:
No order is implied in the above listing.The samples were then plated onto selective media to measure the frequency of h+StrR recombinants that had received certain genes from the Hfr cell.The following graph shows the percentage of recombinants against time in minutes. 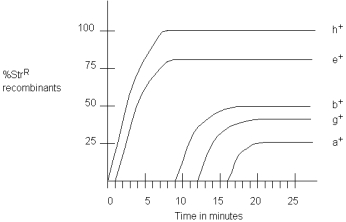 a)Draw a linear map of the Hfr chromosome indicating:
(1)the point of insertion (origin).
(2)the order of the genes a+,b+,e+,g+,and h+.
(3)the shortest distance between consecutive genes on the chromosome in minutes.
b)An additional four Hfr strains (strains 2 5)were obtained.Each carried the wild-type alleles of the genes listed below.They were mated individually to the same F- strain shown above (carrying the recessive alleles of all genes).With interrupted mating,the times of first appearance in minutes of individual Hfr markers in exconjugants were determined,as shown in the following chart.
Minutes Hfr marker 1 2 3 4 5 2 20 11 12 28 10 24 5 35 50 88 35
Draw the genetic map showing:
(1)the positions of genes a through h.
(2)the origins of the Hfrs (including strain 1).
(3)the orientation of the origins.
(4)the shortest distance between consecutive genes or origins.
a)Draw a linear map of the Hfr chromosome indicating:
(1)the point of insertion (origin).
(2)the order of the genes a+,b+,e+,g+,and h+.
(3)the shortest distance between consecutive genes on the chromosome in minutes.
b)An additional four Hfr strains (strains 2 5)were obtained.Each carried the wild-type alleles of the genes listed below.They were mated individually to the same F- strain shown above (carrying the recessive alleles of all genes).With interrupted mating,the times of first appearance in minutes of individual Hfr markers in exconjugants were determined,as shown in the following chart.
Minutes Hfr marker 1 2 3 4 5 2 20 11 12 28 10 24 5 35 50 88 35
Draw the genetic map showing:
(1)the positions of genes a through h.
(2)the origins of the Hfrs (including strain 1).
(3)the orientation of the origins.
(4)the shortest distance between consecutive genes or origins.
(Essay)
4.9/5 (34)
Two labs calculated cotransduction frequencies for the genes A and B.Lab 1 calculated 0.63,and lab 2 calculated 0.47.Which lab reported the genes to be closer together?
(Essay)
4.9/5 (27)
Bernard Davis tested the "cross-feeding" interpretation of some data that showed the phenotype of one microbe as capable of being changed by another microbe.His contribution can be summarized as:
(Multiple Choice)
4.8/5 (38)
An E.coli culture is growing in (rich)liquid medium.A representative sample of this culture is plated on solid rich medium,and 950 colonies grow on this medium.A sample of bacteria from each of these colonies is then plated on minimal medium,and only 108 of these samples grow into a colony.What proportion of the bacteria in the original liquid culture are auxotrophic?
(Multiple Choice)
4.7/5 (43)
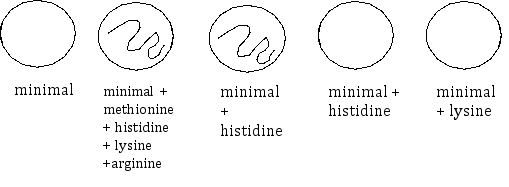
A bacterium with the genotype met+his+lys-arg+ has been transformed with DNA from a second bacterium that has the genotype met+his-lys+arg-. 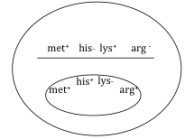 Following the transformation,scientists streaked a sample of a transformed bacterium onto several different plates that contain different nutritional supplements in order to determine the transformant's genotype.Using the results of the experiments (shown below),determine what crossovers occurred to produce the bacterium.On the above diagram,draw the crossovers that are necessary to produce a bacterium that fits the observed growth profile.
(Essay)
4.8/5 (45)
If two bacterial genes are very closely linked (less than one map unit apart),then their frequency of cotransduction will be:
(Multiple Choice)
4.8/5 (37)
Filters
- Essay(0)
- Multiple Choice(0)
- Short Answer(0)
- True False(0)
- Matching(0)