Exam 15: Describing Relationships: Regression, Prediction, and Causation
Exam 1: Where Do Data Come From30 Questions
Exam 2: Samples, Good and Bad30 Questions
Exam 3: What Do Samples Tell Us55 Questions
Exam 4: Sample Surveys in the Real World36 Questions
Exam 5: Experiments, Good and Bad50 Questions
Exam 6: Experiments in the Real World32 Questions
Exam 7: Data Ethics21 Questions
Exam 8: Measuring33 Questions
Exam 9: Do the Numbers Make Sense25 Questions
Exam 10: Graphs, Good and Bad30 Questions
Exam 11: Displaying Distributions With Graphs22 Questions
Exam 13: Normal Distributions54 Questions
Exam 14: Describing Relationships: Scatterplots and Correlation56 Questions
Exam 15: Describing Relationships: Regression, Prediction, and Causation37 Questions
Exam 16: The Consumer Price Index and Government Statistics31 Questions
Exam 17: Thinking About Chance25 Questions
Exam 18: Probability Models30 Questions
Exam 19: Simulation20 Questions
Exam 20: The House Edge: Expected Values30 Questions
Exam 21: What Is a Confidence Interval43 Questions
Exam 22: What Is a Test of Significance30 Questions
Exam 23: Use and Abuse of Statistical Inference18 Questions
Exam 24: Two-Way Tables and the Chi-Square Test47 Questions
Select questions type
A year-long fitness center study sought to determine if there is a relationship between the amount of muscle mass gained y (kilograms) and the weekly time spent working out under the guidance of a trainer x (minutes.) The resulting least-squares regression line for the study is y = 2.04 + 0.12x.
The correlation coefficient for these data is r = 0.95. Which of the following statements is true?
(Multiple Choice)
4.8/5  (35)
(35)
A random sample of patients who attended a clinic was selected. The age of the patient (years) and the number of days since the last visit were collected and are displayed in the figure below. The least-squares regression line for predicting number of days since the last visit from the age of the patient is y = 600.081 - 8.694x.  Using this line, you predict that the number of days since last visit to the clinic for a 50-year-old patient will be about
(Multiple Choice)
4.9/5 (34)
Lean body mass (your weight leaving out fat) helps predict metabolic rate (how many calories of energy you burn in an hour). The relationship is roughly a straight line. The least-squares regression line for predicting metabolic rate (y in calories) from lean body mass (x in kilograms) is y = 113.2 + 26.9x.
Using this regression line, you predict that a person with lean body mass 50 kilograms will have metabolic rate equal to about how many calories?
(Multiple Choice)
4.8/5 (30)
A study of many countries finds a strong positive correlation between the life expectancy in a country and the number of Facebook users in the country. This means that:
(Multiple Choice)
4.7/5 (39)
A education researcher measured the IQ test scores of 78 seventh-grade students in a rural school, and also their school grade point average (GPA) measured on a 12-point scale. Here is a graph of GPA versus IQ for these students: 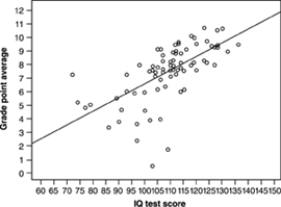 The line drawn on the graph is the least-squares regression line of GPA on IQ. Use this line to predict the GPA of a student with IQ 110. Your prediction is GPA about
(Multiple Choice)
4.7/5 (39)
A year-long fitness center study sought to determine if there is a relationship between the amount of muscle mass gained y (kilograms) and the weekly time spent working out under the guidance of a trainer x (minutes.) The resulting least-squares regression line for the study is y = 2.04 + 0.12x.
We can see from the equation of the line that, as the weekly time spent working out x goes up,
(Multiple Choice)
4.8/5 (41)
Consider a large number of countries around the world. There is a positive correlation between the number of cell phones per person x and the average life expectancy y. Does this mean that we could increase the life expectancy in Rwanda by shipping cell phones to that country?
(Multiple Choice)
4.9/5 (30)
A random sample of patients who attended a clinic was selected. The age of the patient (years) and the number of days since the last visit were collected and are displayed in the figure below. The least-squares regression line for predicting number of days since the last visit from the age of the patient is y = 600.081 - 8.694x.  The slope of this line tells us the
(Multiple Choice)
4.7/5 (36)
What can we say about the relationship between a correlation r and the slope b of the least-squares line for the same set of data?
(Multiple Choice)
4.7/5 (38)
A study of 6,600 men found that those who consumed a moderate amount of alcohol (one drink or less per night) have lower mortality (on the average) than those who drink none. Is this good evidence that drinking a moderate amount causes lower mortality?
(Multiple Choice)
4.8/5 (44)
Deaths from highway accidents went down after the adoption of a national 55 mile-per-hour speed limit. Can we be confident that the lower speed limit caused the drop in deaths?
(Multiple Choice)
4.9/5 (33)
Lean body mass (your weight leaving out fat) helps predict metabolic rate (how many calories of energy you burn in an hour). The relationship is roughly a straight line. The least-squares regression line for predicting metabolic rate (y in calories) from lean body mass (x in kilograms) is y = 113.2 + 26.9x.
The slope of the regression line is
(Multiple Choice)
4.9/5 (34)
A random sample of patients who attended a clinic was selected. The age of the patient (years) and the number of days since the last visit were collected and are displayed in the figure below. The least-squares regression line for predicting number of days since the last visit from the age of the patient is y = 600.081 - 8.694x. 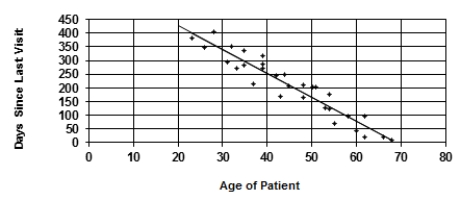 The slope of this line is
(Multiple Choice)
4.8/5 (29)
A study of the effects of television measured how many hours of television each of 125 grade school children watched per week during a school year and their reading scores. The study found that children who watch more television tend to have lower reading scores than children who watch fewer hours of television. The study report says that "Hours of television watched explained 9% of the observed variation in the reading scores of the 125 subjects." The correlation between hours of TV and reading score must be
(Multiple Choice)
4.8/5 (32)
A year-long fitness center study sought to determine if there is a relationship between the amount of muscle mass gained y (kilograms) and the weekly time spent working out under the guidance of a trainer x (minutes.) The resulting least-squares regression line for the study is y = 2.04 + 0.12x.
Suppose you worked out for two hours (120 minutes) per week, how much muscle mass gain would you predict?
(Multiple Choice)
4.9/5 (32)
Filters
- Essay(0)
- Multiple Choice(0)
- Short Answer(0)
- True False(0)
- Matching(0)