Exam 1: Linear Equations and Functions
Exam 1: Linear Equations and Functions245 Questions
Exam 2: Quadratic and Other Special Functions120 Questions
Exam 3: Matrices230 Questions
Exam 4: Inequalities and Linear Programming119 Questions
Exam 5: Exponential and Logarithmic Functions109 Questions
Exam 6: Mathematics of Finance131 Questions
Exam 7: Introduction to Probability180 Questions
Exam 8: Further Topics in Probability and Data Description114 Questions
Exam 9: Derivatives249 Questions
Exam 10: Derivatives172 Questions
Exam 11: Derivatives Continued139 Questions
Exam 12: Indefinite Integrals120 Questions
Exam 13: Definite Integrals - Techniques370 Questions
Exam 13: A: Definite Integrals - Techniques370 Questions
Exam 14: Functions of Two or More Variables122 Questions
Exam 15: Algebraic Concepts 240 Questions
Exam 15: Algebraic Concepts 374 Questions
Exam 15: Algebraic Concepts 496 Questions
Exam 15: Algebraic Concepts 599 Questions
Select questions type
If the demand and supply functions for Z-brand phones are  and
and 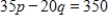 respectively, compare the quantity demanded and the quantity supplied when p = 46. Note that q is the quantity produced or sold. Are there surplus phones or not enough to meet demand?
(Multiple Choice)
4.8/5  (32)
(32)
Mr. Jackson borrowed money from his bank and on his life insurance to start a business. His interest rate on the bank loan was 10%, and his rate on the insurance loan was 12%. If the total amount borrowed was $100,000 and his total yearly interest payment was $10,200, how much did he borrow from the bank?
(Multiple Choice)
5.0/5 (38)
Given a cost function 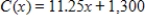 and a revenue function
  , where x represents the number of units produced and sold, find the profit function and then determine the marginal profit.
(Multiple Choice)
4.8/5 (33)
The percent p of high school seniors who smoke cigarettes can be modeled by the equation 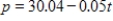 , where t is the number of years past 1975. Find the year in which p first becomes negative. Round your answer to the nearest year.
(Multiple Choice)
4.8/5 (33)
A manufacturer sells watches for $75 per unit. The fixed costs related to this product are $10,000 per month, and the variable costs are $55 per unit. This gives a profit function 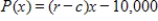 , where r is the revenue per unit and c is the variable cost per unit. If the manufacturer has a profit of zero, how many watches were sold?
(Multiple Choice)
4.8/5 (41)
A manufacturer sells watches for $60 per unit. The fixed costs related to this product are $10,000 per month, and the variable costs are $40 per unit. Which of the following is the equation for the profit function  where x denotes the number of watches produced and sold?
(Multiple Choice)
4.7/5 (35)
When a debt is refinanced, sometimes the term of the loan (that is, the time it takes to repay the debt) is shortened. Suppose the current interest rate is 7%, and the current debt is $100,000. The monthly payment R of the refinanced debt is a function of the term of the loan t in years. If we represent this function by  , then the following table defines the function.
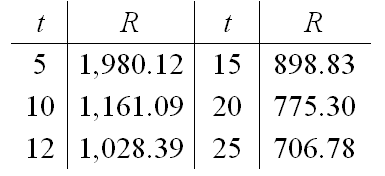
Source: Comprehensive Mortgage Payment Tables, Publication No. 492, Financial Publishing Co., Boston
Choose the correct verbal description of
Source: Comprehensive Mortgage Payment Tables, Publication No. 492, Financial Publishing Co., Boston
Choose the correct verbal description of  .
.
(Multiple Choice)
4.8/5 (34)
Burnem, Inc. manufactures blank CDs and sells them to a distributor in packs of 500 CDs. Assume Burnem's total cost and total revenue (in dollars) for x packs of 500 CDs are given by
Total cost =  Total revenue =
How many packs of 500 CDs must Burnem sell to break even?
How many packs of 500 CDs must Burnem sell to break even?
(Multiple Choice)
4.9/5 (36)
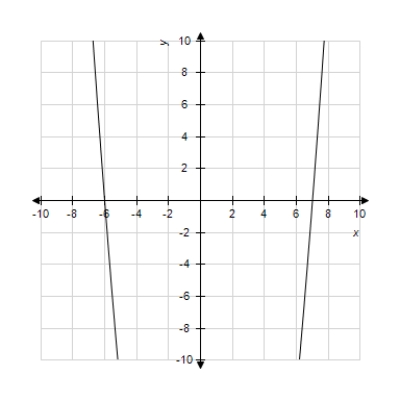
Choose the graph that represents the equation below.

(Multiple Choice)
4.9/5 (33)
The figure below show the demand and supply functions for a product. Decide which line shows the supply function and which line the demand function. 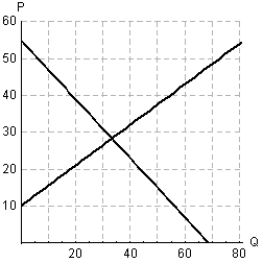
Will a price above the equilibrium price result in a market surplus or shortage?
Will a price above the equilibrium price result in a market surplus or shortage?
(Multiple Choice)
4.8/5 (32)
Each day, a young person should sleep 8 hours, plus  hour for each year that the person is under 19 years of age. Assuming the relation is linear, write the equation relating hours of sleep y and age x where
  .
.
(Multiple Choice)
4.8/5 (30)
Graph the equation with a graphing utility using the specified range. Is the graph below the graph of the given equation? 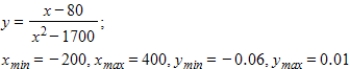

(True/False)
4.9/5 (40)
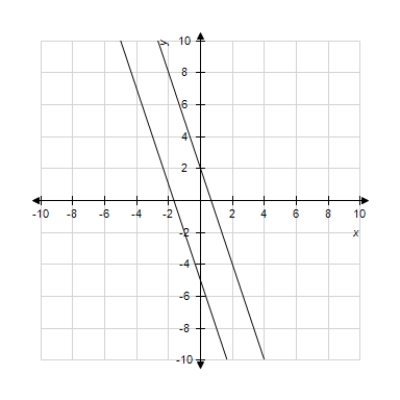
The graphs of the two equations below are shown. The lines representing these equations may be the same, may intersect once, or may be parallel. Decide whether the system of equations in the problem has one solution, no solution, or an infinite number of solutions.  and
and 
(Multiple Choice)
4.8/5 (30)
Graph the function below and experiment with the viewing window to obtain a complete graph, adjusting the ranges where necessary. Does the figure below show the complete graph?

(True/False)
4.8/5 (32)
A function and its graph are given. Find the domain. 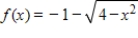
(Multiple Choice)
4.8/5 (33)
Determine whether the following pairs of equations represent parallel lines, perpendicular lines, or neither of these. 

(Multiple Choice)
4.8/5 (29)
Filters
- Essay(0)
- Multiple Choice(0)
- Short Answer(0)
- True False(0)
- Matching(0)