Exam 1: Linear Equations and Functions
Exam 1: Linear Equations and Functions245 Questions
Exam 2: Quadratic and Other Special Functions120 Questions
Exam 3: Matrices230 Questions
Exam 4: Inequalities and Linear Programming119 Questions
Exam 5: Exponential and Logarithmic Functions109 Questions
Exam 6: Mathematics of Finance131 Questions
Exam 7: Introduction to Probability180 Questions
Exam 8: Further Topics in Probability and Data Description114 Questions
Exam 9: Derivatives249 Questions
Exam 10: Derivatives172 Questions
Exam 11: Derivatives Continued139 Questions
Exam 12: Indefinite Integrals120 Questions
Exam 13: Definite Integrals - Techniques370 Questions
Exam 13: A: Definite Integrals - Techniques370 Questions
Exam 14: Functions of Two or More Variables122 Questions
Exam 15: Algebraic Concepts 240 Questions
Exam 15: Algebraic Concepts 374 Questions
Exam 15: Algebraic Concepts 496 Questions
Exam 15: Algebraic Concepts 599 Questions
Select questions type
Use a graphing utility with the standard viewing window  and
and  to graph the function. Choose the correct graph below.
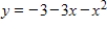
(Multiple Choice)
4.9/5  (33)
(33)
Suppose the percent of U.S. high school seniors from 1975 to 2001 who used marijuana can be modeled by 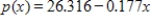 percent, where x is the number of years past 1975. Choose the correct interpretation the slope in this equation as a rate of change.
(Multiple Choice)
4.8/5 (34)
The equation in this problem leads to a linear equation. Solve for x. Because the solution to the linear equation may not be a solution to the original equation, be sure to check the solution in the original equation. 
(Multiple Choice)
4.8/5 (32)
Solve the inequality and choose the graph of the solution. 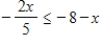
(Multiple Choice)
4.8/5 (30)
A nut wholesaler sells a mix of cashews and peanuts. He charges $2.80 per pound for cashews and $5.30 per pound for peanuts. If the mix is to sell for $3.1 per pound, how many pounds each of peanuts and cashews should be used to make 100 pounds of the mix?
(Multiple Choice)
4.8/5 (34)
In seawater, the pressure p is related to the depth d according to 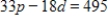 , where d is in feet and p is in pounds per square inch. The Titanic was discovered at a depth of 12,460 ft. Find the pressure at this depth. Round your answer to the nearest whole number.
(Multiple Choice)
4.7/5 (46)
A linear cost function is 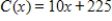 , where x represents the number of units produced. If 60 units are currently produced, determine the marginal cost.
(Multiple Choice)
4.8/5 (25)
Write the equation of the line through (8, -7) that is perpendicular to 
(Multiple Choice)
4.8/5 (29)
Assume that the price for a pair of shoes has been set at $20. The demand for a pair of shoes is given by  and the supply for the same pair of shoes is
  . In both cases p is price per pair and q is the quantity produced or sold. Compare the quantity demanded and the quantity supplied. Will there be a surplus or shortfall at this price?
(Multiple Choice)
4.8/5 (35)
Solve the system by elimination, or by any convenient method. 
(Multiple Choice)
4.8/5 (33)
Solve the system of equations by using graphical methods. 
(Multiple Choice)
4.8/5 (35)
A shoe store owner will buy 10 pairs of a certain shoe if the price is $75 per pair and 30 pairs if the price is $25. The supplier of the shoes is willing to provide 40 pairs if the price is $90 per pair but only 5 pairs if the price is $20. Assuming the supply and demand functions for the shoes are linear, find the market equilibrium point  .
.
(Multiple Choice)
4.9/5 (35)
A woman has $289,000 invested in two rental properties. One yields 10% on the investment, and the other yields 12%. Her total income from them is $33,000. How much is her income from each property?
(Multiple Choice)
4.8/5 (32)
The figure below is the graph of both the demand function D and the supply function S for the same product, where P is the price per unit and Q is the number of units produced. Will there be a market surplus or shortage when the price P is $150? 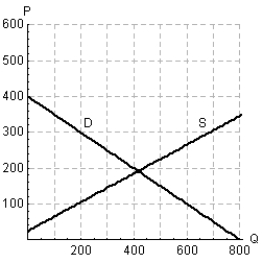
(Multiple Choice)
4.8/5 (36)
Filters
- Essay(0)
- Multiple Choice(0)
- Short Answer(0)
- True False(0)
- Matching(0)