Exam 1: Linear Equations and Functions
Exam 1: Linear Equations and Functions245 Questions
Exam 2: Quadratic and Other Special Functions120 Questions
Exam 3: Matrices230 Questions
Exam 4: Inequalities and Linear Programming119 Questions
Exam 5: Exponential and Logarithmic Functions109 Questions
Exam 6: Mathematics of Finance131 Questions
Exam 7: Introduction to Probability180 Questions
Exam 8: Further Topics in Probability and Data Description114 Questions
Exam 9: Derivatives249 Questions
Exam 10: Derivatives172 Questions
Exam 11: Derivatives Continued139 Questions
Exam 12: Indefinite Integrals120 Questions
Exam 13: Definite Integrals - Techniques370 Questions
Exam 13: A: Definite Integrals - Techniques370 Questions
Exam 14: Functions of Two or More Variables122 Questions
Exam 15: Algebraic Concepts 240 Questions
Exam 15: Algebraic Concepts 374 Questions
Exam 15: Algebraic Concepts 496 Questions
Exam 15: Algebraic Concepts 599 Questions
Select questions type
Graph the equation with a standard window  and
and  on a graphing utility. Does the graph appear to be a linear function?

(True/False)
4.9/5  (35)
(35)
Financial Paper, Inc. is a printer of checks and forms for financial institutions. For individual accounts, boxes of 200 checks cost $0.8 per box to print and package; they sell for $4.95 each. Financial Paper's monthly fixed costs for printing and packaging these checks for individuals are $1,415. Which of the following is the equation for the profit function  where x denotes the number of boxes of checks produced and sold?
(Multiple Choice)
4.8/5 (36)
A concert promoter needs to make $42,000 from the sale of 2,000 tickets. The promoter charges $20 for some tickets and $30 for the others. Let x be the number of $20 tickets, and y be the number of $30 tickets. This yields the two equations  and
and 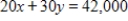 . Solve these equations simultaneously to find how many $30 tickets must be sold to yield $42,000.
(Multiple Choice)
4.9/5 (34)
The equation in this problem leads to a linear equation. Solve for x. Because the solution to the linear equation may not be a solution to the original equation, be sure to check the solution in the original equation. 
(Multiple Choice)
4.8/5 (40)
Solve the inequality and choose the graph of the solution.
(Multiple Choice)
4.7/5 (31)
Find the slope of the line passing through the given pair of points.  and
and 
(Multiple Choice)
4.7/5 (37)
Use a graphing utility with the standard viewing window  and
and  to graph the function. Choose the correct graph below.
(Multiple Choice)
4.8/5 (37)
Using a graphing utility or Excel to find the solution of the system. 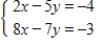
(Multiple Choice)
4.9/5 (43)
Suppose a calculator manufacturer has the total cost function 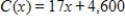 and the total revenue function
  , where x represents the number of calculators sold. What is the equation of the profit function,
  , for the calculator manufacturer?
(Multiple Choice)
4.8/5 (30)
Suppose a radio manufacturer has the total cost function 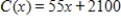 and the total revenue function
  , where x represents the number of radios produced and sold. Write down the profit function
  and then use this function to determine how many radios must be sold to avoid losing money. Round your answer to the nearest whole number.
(Multiple Choice)
4.8/5 (39)
Two models for measuring the effects of high temperature and humidity are the Summer Simmer Index and the Apparent Temperature. For an outside temperature of  , these indices relate the relative humidity, H (expressed as a decimal), to the perceived temperature as follows.
Summer Simmer:
, these indices relate the relative humidity, H (expressed as a decimal), to the perceived temperature as follows.
Summer Simmer: 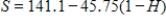 Apparent Temperature:
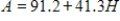
For each index, find the point that corresponds to a relative humidity of 45%. Round your answer to two decimal places.
For each index, find the point that corresponds to a relative humidity of 45%. Round your answer to two decimal places.
(Multiple Choice)
4.9/5 (38)
Write the equation of the line passing through the given pair of points.
(5,11) and (12,4)
(Multiple Choice)
4.9/5 (39)
The percent p of high school seniors who smoke cigarettes can be described by  , where t is the number of years past 1975. Choose the sentence that correctly interprets the meaning of the slope as a rate of change.
(Multiple Choice)
4.9/5 (34)
The figure below is the graph of the demand function D, the supply function S, and the supply function after a $30 tax T for the same product. Is it possible for the government to earn no money if it keeps increasing taxes on this product?
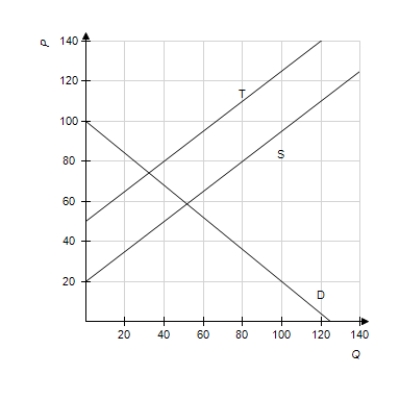
(True/False)
4.7/5 (30)
Filters
- Essay(0)
- Multiple Choice(0)
- Short Answer(0)
- True False(0)
- Matching(0)