Exam 12: Chi-Square Tests
Exam 1: An Introduction to Business Statistics54 Questions
Exam 2: Descriptive Statistics: Tabular and Graphical Methods90 Questions
Exam 3: Descriptive Statistics: Numerical Methods149 Questions
Exam 4: Probability135 Questions
Exam 5: Discrete Random Variables128 Questions
Exam 6: Continuous Random Variables150 Questions
Exam 7: Sampling and Sampling Distributions116 Questions
Exam 8: Confidence Intervals144 Questions
Exam 9: Hypothesis Testing148 Questions
Exam 10: Statistical Inferences Based on Two Samples132 Questions
Exam 11: Experimental Design and Analysis of Variance115 Questions
Exam 12: Chi-Square Tests96 Questions
Exam 13: Simple Linear Regression Analysis148 Questions
Exam 14: Multiple Regression122 Questions
Exam 15: Model Building and Model Diagnostics102 Questions
Exam 16: Time Series Forecasting150 Questions
Exam 17: Process Improvement Using Control Charts122 Questions
Exam 18: Nonparametric Methods97 Questions
Exam 19: Decision Theory90 Questions
Select questions type
In performing a chi-square test of independence,as the difference between the respective observed and expected frequencies decrease,the probability of concluding that the row variable is independent of the column variable decreases.
Free
(True/False)
4.7/5  (36)
(36)
Correct Answer: Verified
False
A real estate company is analyzing the selling prices of residential homes in a given community.140 homes that have been solved in the past month are randomly selected and their selling prices are recorded.The statistician working on the project has stated that in order to perform various statistical tests,the data must be distributed according to normal distribution.In order to determine whether the selling prices of homes included in the random sample are normally distributed,the data is divided into 6 classes of equal size and the number of observations in each class is recorded.The chi-square goodness of fit test for normal distribution is performed and the results are summarized in the following table: 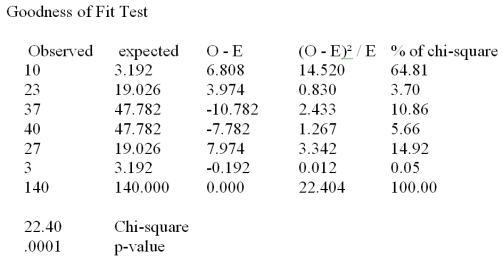 What are the degrees of freedom for the chi-square test?
Free
(Multiple Choice)
4.8/5 (33)
Correct Answer:Verified
B
A human resource manager is interested in whether absences occur during the week with equal frequency.The manager took a random sample of 100 absences and created the following table: 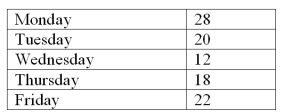 How many degrees of freedom are associated with the chi-square test? Use = .05 and determine the rejection point condition of the chi-square statistic.
Free
(Multiple Choice)
4.7/5 (34)
Correct Answer:Verified
C
A manufacturing company produces part 2205 for the aerospace industry.This particular part can be manufactured using 3 different production processes.The management wants to know if the quality of the units of part 2205 is the same for all three processes.The production supervisor obtained the following data: The Process 1 had 29 defective units in 240 items;Process 2 produced 12 defective units in 180 items and Process 3 manufactured 9 defective units in 150 items. 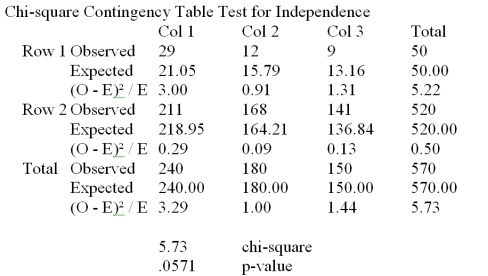 At a significance level of .05,the management wants to perform a hypothesis test to determine if the quality of the items produced appears to be independent of the production process used.Based on the results summarized in the Mega-Stat/Excel output provided in the table above,we:
(Multiple Choice)
4.8/5 (28)
The chi-square goodness of fit test can only be used to test whether a population has specified multinomial probabilities or to test if a sample has been selected from a normally distributed population.It cannot be applied to test if a sample data comes from other distribution forms such as Poisson.
(True/False)
4.8/5 (42)
The 2 statistic is used to test whether the assumption of normality is reasonable for a given population distribution.The sample consists of 5000 observations and is divided into 6 categories (intervals).The degrees of freedom for the chi-square statistic are:
(Multiple Choice)
4.9/5 (32)
Consider a set of 50 measurements with mean 50.2 and standard deviation 18.7 and with the following observed frequencies. 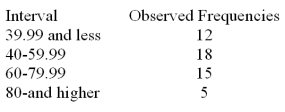 It is desired to test whether these measurements came from a normal population. Calculate the expected frequency for the interval 0-39.99.
(Multiple Choice)
4.9/5 (35)
The chi-square distribution is a continuous probability distribution that is skewed to the left.
(True/False)
4.9/5 (40)
A manufacturing company produces part 2205 for the aerospace industry.This particular part can be manufactured using 3 different production processes.The management wants to know if the quality of the units of part 2205 is the same for all three processes.The production supervisor obtained the following data: The Process 1 had 29 defective units in 240 items;Process 2 produced 12 defective units in 180 items and Process 3 manufactured 9 defective units in 150 items.At a significance level of .05,we performed a chi-square test to determine whether the quality of the items produced appear to be the same for all three processes.What is the null hypothesis?
(Multiple Choice)
4.9/5 (32)
When using chi-square goodness of fit test with multinomial probabilities,the rejection of the null hypothesis indicates that at least one of the multinomial probabilities is not equal to the value stated in the null hypothesis.
(True/False)
4.9/5 (37)
When we carry out a chi-square test of independence,if ri is row total for row i and cj is the column total for column j,then the estimated expected cell frequency corresponding to row i and column j equals (ri)(cj)/n.
(True/False)
4.9/5 (31)
On the most recent tax cut proposal,a random sample of Democrats and Republicans in the Congress cast their votes as follows: 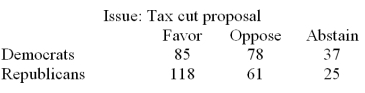 Use a significance level of .01 and determine if the opinions on the tax cut proposal and the party affiliation are independent.
(Multiple Choice)
4.8/5 (30)
A U.S.based internet company offers an on-line proficiency course in basic accounting.Completion of this online course satisfies the "Fundamentals of Accounting" course requirement in many MBA programs.In the first semester 315 students have enrolled in the course.The marketing research manager divided the country into seven regions of approximately equal populations.The course enrollment values in each of the seven regions are given below.The management wants to know if there is equal interest in the course across all regions. 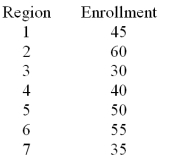 Calculate the expected enrollment (frequency)for all 7 regions.
(Multiple Choice)
4.9/5 (30)
Consider the 3X2 contingency table below. 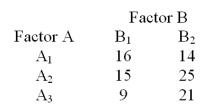 At
At  = .05,determine the tabular value of the chi-square statistic used to test for the independence of Factors A and B?
(Multiple Choice)
4.9/5 (38)
A U.S.based internet company offers an on-line proficiency course in basic accounting.Completion of this online course satisfies the "Fundamentals of Accounting" course requirement in many MBA programs.In the first semester 315 students have enrolled in the course.The marketing research manager divided the country into seven regions of approximately equal populations.The course enrollment values in each of the seven regions are given below.The management wants to know if there is equal interest in the course across all regions. 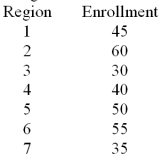 At a significance level of .01,test H0: the probabilities are equal for all seven regions.
(Multiple Choice)
4.8/5 (34)
A real estate company is analyzing the selling prices of residential homes in a given community.140 homes that have been solved in the past month are randomly selected and their selling prices are recorded.The statistician working on the project has stated that in order to perform various statistical tests,the data must be distributed according to normal distribution.In order to determine whether the selling prices of homes included in the random sample are normally distributed,the data is divided into 6 classes of equal size and the number of observations in each class is recorded.The chi-square goodness of fit test for normal distribution is performed and the results are summarized in the following table: 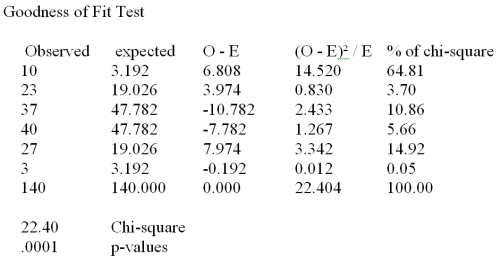 What is the appropriate null hypothesis?
(Multiple Choice)
4.9/5 (32)
One use of the chi-square goodness of fit test is to determine if specified multinomial probabilities in the null hypothesis is correct.
(True/False)
4.8/5 (31)
Consider a set of 50 measurements with mean 50.2 and standard deviation 18.7 and with the following observed frequencies. 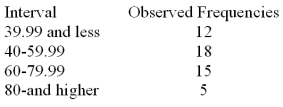 It is desired to test whether these measurements came from a normal population. Calculate the expected frequency for the interval 80 and higher.
(Multiple Choice)
4.8/5 (42)
Consider a set of 50 measurements with mean 50.2 and standard deviation 18.7 and with the following observed and expected frequencies. 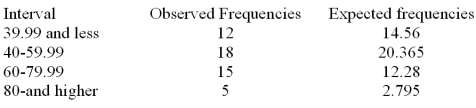 It is desired to test whether these measurements came from a normal population.At a significance level of .05,test H0: the set of 50 measurements came from a normal population.
(Multiple Choice)
5.0/5 (34)
A manufacturing company produces part 2205 for the aerospace industry.This particular part can be manufactured using 3 different production processes.The management wants to know if the quality of the units of part 2205 is the same for all three processes.The production supervisor obtained the following data: Process 1 had 29 defective units in 240 items;Process 2 produced 12 defective units in 180 items and Process 3 manufactured 9 defective units in 150 items.At a significance level of .05,the management wants to perform a hypothesis test to determine whether the quality of items produced appears to be independent of the production process used.Calculate the expected number of defective units produced by Process 1.
(Multiple Choice)
4.7/5 (35)
Filters
- Essay(0)
- Multiple Choice(0)
- Short Answer(0)
- True False(0)
- Matching(0)