Exam 13: Simple Linear Regression Analysis
Exam 1: An Introduction to Business Statistics54 Questions
Exam 2: Descriptive Statistics: Tabular and Graphical Methods90 Questions
Exam 3: Descriptive Statistics: Numerical Methods149 Questions
Exam 4: Probability135 Questions
Exam 5: Discrete Random Variables128 Questions
Exam 6: Continuous Random Variables150 Questions
Exam 7: Sampling and Sampling Distributions116 Questions
Exam 8: Confidence Intervals144 Questions
Exam 9: Hypothesis Testing148 Questions
Exam 10: Statistical Inferences Based on Two Samples132 Questions
Exam 11: Experimental Design and Analysis of Variance115 Questions
Exam 12: Chi-Square Tests96 Questions
Exam 13: Simple Linear Regression Analysis148 Questions
Exam 14: Multiple Regression122 Questions
Exam 15: Model Building and Model Diagnostics102 Questions
Exam 16: Time Series Forecasting150 Questions
Exam 17: Process Improvement Using Control Charts122 Questions
Exam 18: Nonparametric Methods97 Questions
Exam 19: Decision Theory90 Questions
Select questions type
An experiment was performed on a certain metal to determine if the strength is a function of heating time.The simple linear regression equation is  = 1 + 1X and sample coefficient of determination (r2)= .7777.The time is in minutes and the strength is measured in pounds per square inch.Test to determine if there is a significant correlation between the heating time and strength of the metal. Using H0: = 0 vs.HA: 0 at = .05,determine the test statistic and decision.
Free
(Multiple Choice)
4.8/5  (35)
(35)
Correct Answer: Verified
C
An experiment was performed on a certain metal to determine if the strength is a function of heating time.95% prediction interval for the strength of a metal sheet when the average heating time is 4 minutes is from 3.235 to 6.765.We are 95% confident that an individual sheet of metal heated for four minutes will have strength of at least 4 pounds per square inch.Do you agree with this statement?
Free
(Multiple Choice)
4.9/5 (44)
Correct Answer:Verified
B
All of the following are assumptions of the error terms in the simple linear regression model except
Free
(Multiple Choice)
4.8/5 (32)
Correct Answer:Verified
D
If there is significant autocorrelation present in a data set the ________________ assumption is violated.
(Multiple Choice)
4.7/5 (40)
A local tire dealer wants to predict the number of tires sold each month.He believes that the number of tires sold is a linear function of the amount of money invested in advertising.He randomly selects 6 months of data consisting of tire sales (in thousands of tires)and advertising expenditures (in thousands of dollars).Based on the data set with 6 observations,the simple linear regression equation of the least squares line is  = 3 + 1x.
  = 24
= 24  = 124
= 124  = 42
= 42  = 338
= 338  = 196 MSE = 4
Using the sums of the squares given above,determine the 90% prediction interval for an individual month's tire sales when the advertising expenditure is $5000.
= 196 MSE = 4
Using the sums of the squares given above,determine the 90% prediction interval for an individual month's tire sales when the advertising expenditure is $5000.
(Multiple Choice)
4.9/5 (32)
A local tire dealer wants to predict the number of tires sold each month.He believes that the number of tires sold is a linear function of the amount of money invested in advertising.He randomly selects 6 months of data consisting of tire sales (in thousands of tires)and advertising expenditures (in thousands of dollars).Based on the data set with 6 observations,the simple linear regression model yielded the following results.  = 24
= 24  = 124
= 124  = 42
= 42  = 338
= 338  = 196 Determine the value of the estimated y intercept.
(Multiple Choice)
4.9/5 (32)
The residual is the difference between the observed value of the dependent variable and the predicted value of the dependent variable.
(True/False)
4.9/5 (34)
An experiment was performed on a certain metal to determine if the strength is a function of heating time.The sample size consists of ten metal sheets.Residuals are calculated for all ten metal sheets and ordered from smallest to largest. Determine the normal point for the smallest residual.
(Multiple Choice)
5.0/5 (30)
For the same set of observations on a specified dependent variable two different independent variables were used to develop two separate simple linear regression models.A portion of the results is presented below. 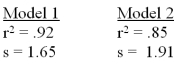 Based on the results given above,we can conclude that:
(Multiple Choice)
4.8/5 (34)
The ___________ the r2,and the __________ the s (standard error),the stronger the relationship between the dependent variable and the independent variable.
(Multiple Choice)
4.7/5 (35)
Regression Analysis 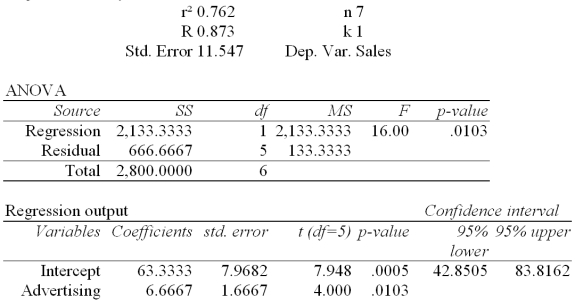 The local grocery store wants to predict the daily sales in dollars.The manager believes that the amount of newspaper advertising significantly affects the store sales.He randomly selects 7 days of data consisting of daily grocery store sales (in thousands of dollars)and advertising expenditures (in thousands of dollars).The Excel/Mega-Stat output given above summarizes the results of the regression model. What are the limits of the 99% prediction interval of the daily sales in dollars of an individual grocery store that has spent $3000 on advertising expenditures? The distance value for this particular prediction is reported as .164.
(Multiple Choice)
4.8/5 (41)
An experiment was performed on a certain metal to determine if the strength is a function of heating time.Partial results based on a sample of 10 metal sheets are given below.The simple linear regression equation is  = 1 + 1X .The time is in minutes and the strength is measured in pounds per square inch,MSE = 0.5,
  = 30,
= 30,  = 104. Determine the 95% prediction interval for the strength of a metal sheet when the average heating time is 4 minutes.The distance value has been found to be equal to 0.17143.
(Multiple Choice)
4.9/5 (32)
The following results were obtained as a part of simple regression analysis: r2= .9162
F statistic from the F table = 3.59
Calculated value of F from the ANOVA table = 81.87  = .05
P-value = .000
The null hypothesis of no linear relationship between the dependent variable and the independent variable
= .05
P-value = .000
The null hypothesis of no linear relationship between the dependent variable and the independent variable
(Multiple Choice)
4.7/5 (31)
In simple regression analysis,the quantity  is called the __________ sum of squares.
(Multiple Choice)
4.9/5 (32)
The ______ is the range of the previously observed values of x.
(Multiple Choice)
4.8/5 (24)
After plotting the data point s on a scatter diagram,we have observed an inverse relationship between the independent variable (X)and the dependent variable (Y).Therefore,we can expect both the sample slope and the __________ to be a negative value.
(Multiple Choice)
4.9/5 (27)
Consider the following partial computer output from a simple linear regression analysis. 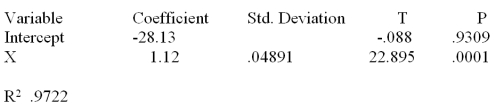 What is the predicted value of y when x = 1,000?
(Multiple Choice)
4.9/5 (37)
Consider the following partial computer output from a simple linear regression analysis. 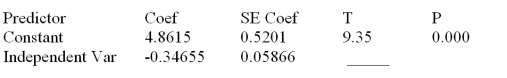 S = 0.4862 R-Sq = ______ Analysis of Variance
 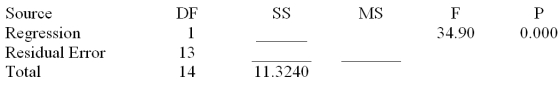 What is the estimated slope?
(Multiple Choice)
4.9/5 (42)
A local tire dealer wants to predict the number of tires sold each month.He believes that the number of tires sold is a linear function of the amount of money invested in advertising.He randomly selects 6 months of data consisting of tire sales (in thousands of tires)and advertising expenditures (in thousands of dollars).Based on the data set with 6 observations,the simple linear regression equation of the least squares line is  = 3 + 1x.
  = 24
= 24  = 124
= 124  = 42
= 42  = 338
= 338  = 196 MSE = 4
Using the sums of the squares given above,determine the 90% confidence interval for the mean value of monthly tire sales when the advertising expenditure is $5000.
= 196 MSE = 4
Using the sums of the squares given above,determine the 90% confidence interval for the mean value of monthly tire sales when the advertising expenditure is $5000.
(Multiple Choice)
4.9/5 (33)
An experiment was performed on a certain metal to determine if the strength is a function of heating time.95% confidence interval for the average strength of a metal sheet when the average heating time is 4 minutes is from 4.325 to 5.675.Therefore,we are confident at = .05 that the average strength of metal heated for four minutes is between 4.325 and 5.675 pounds per square inch.Do you agree or disagree with this statement?
(Multiple Choice)
4.8/5 (38)
Filters
- Essay(0)
- Multiple Choice(0)
- Short Answer(0)
- True False(0)
- Matching(0)