Exam 16: Time Series Forecasting
Exam 1: An Introduction to Business Statistics54 Questions
Exam 2: Descriptive Statistics: Tabular and Graphical Methods90 Questions
Exam 3: Descriptive Statistics: Numerical Methods149 Questions
Exam 4: Probability135 Questions
Exam 5: Discrete Random Variables128 Questions
Exam 6: Continuous Random Variables150 Questions
Exam 7: Sampling and Sampling Distributions116 Questions
Exam 8: Confidence Intervals144 Questions
Exam 9: Hypothesis Testing148 Questions
Exam 10: Statistical Inferences Based on Two Samples132 Questions
Exam 11: Experimental Design and Analysis of Variance115 Questions
Exam 12: Chi-Square Tests96 Questions
Exam 13: Simple Linear Regression Analysis148 Questions
Exam 14: Multiple Regression122 Questions
Exam 15: Model Building and Model Diagnostics102 Questions
Exam 16: Time Series Forecasting150 Questions
Exam 17: Process Improvement Using Control Charts122 Questions
Exam 18: Nonparametric Methods97 Questions
Exam 19: Decision Theory90 Questions
Select questions type
The Consumer Price Index and the Producer Price Index are both calculated using the _________ index formula.
Free
(Multiple Choice)
4.8/5  (34)
(34)
Correct Answer: Verified
C
Consider the quarterly production data (in thousands of units)for the XYZ manufacturing company below.  Calculate the 4 period (quarter)moving average for the entire time series.
Free
(Essay)
4.8/5 (41)
Correct Answer:Verified
14.5,17.5,18.5,22,23.5,24.5,26.25,27.25,29.5
The _______ component of time series consists of erratic and unsystematic fluctuations in a time series data.
Free
(Multiple Choice)
4.8/5 (37)
Correct Answer:Verified
D
Consider the quarterly production data (in thousands of units)for the XYZ manufacturing company below. 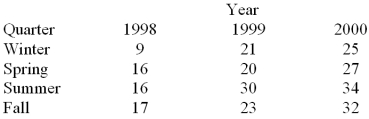 Calculate the ratio of actual production to the centered moving average values (snt * irt)for the entire time series.
(Essay)
5.0/5 (29)
Seasonal variations are periodic patterns in a time series that are repeated over time.For which one of the following time series variables,it is not possible to recognize seasonal variations?
(Multiple Choice)
4.8/5 (39)
Two forecasting models were used to predict the future values of a time series.The forecasts are shown below with the actual values. 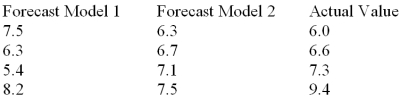 Calculate the mean squared deviation (MSD)for Model 2
(Essay)
4.9/5 (31)
Given the following data 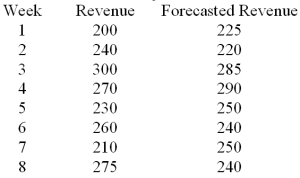 Compute the mean squared error (deviation).
(Multiple Choice)
4.8/5 (38)
Two forecasting models were used to predict the future values of a time series.The forecasts are shown below with the actual values:  Which model is the most accurate? Why?
(Essay)
4.8/5 (39)
Which of the following time-series forecasting methods would not be used to forecast a time series that exhibits a linear trend with no seasonal or cyclical patterns?
(Multiple Choice)
5.0/5 (30)
Given the following data 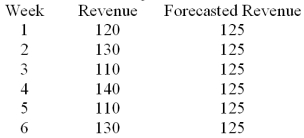 Compute the mean squared deviation (error).
(Multiple Choice)
4.7/5 (27)
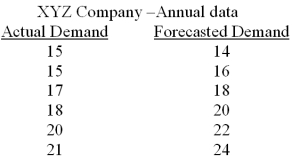 Use this equation to forecast the demand for this product and calculate the MAD.
(Multiple Choice)
4.8/5 (33)
The following data on prices and quantities for the years 1995 and 2000 are given for three products. 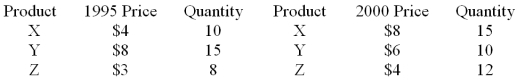 Calculate the Paasche index.
(Essay)
4.9/5 (26)
Two forecasting models were used to predict the future values of a time series.The forecasts are shown below with the actual values: 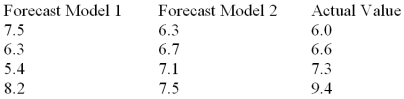 Calculate the mean absolute deviation (MAD)for Model 1.
(Essay)
5.0/5 (36)
Two forecasting models were used to predict the future values of a time series.The forecasts are shown below with the actual values: 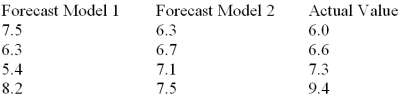 Calculate the mean absolute deviation (MAD)for Model 2.
(Essay)
4.8/5 (32)
Removing the seasonal affect by dividing the actual time series observation by the estimated seasonal factor associated with the time series observation is called deseasonalization.
(True/False)
4.9/5 (36)
Consider the quarterly production data (in thousands of units)for the XYZ manufacturing company below.The normalized (adjusted)seasonal factors are .9982,.9263,1.139,.9365 for winter,spring,summer and fall respectively. 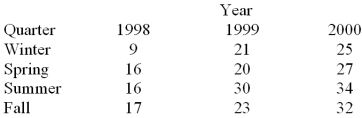 Based on the following deseasonalized observations (dt)given below,a trend line was estimated.The linear regression trend equation is: trt = 10.1 + 1.91 (t).Based on this trend equation,the following trend values are calculated for each period in the time series:
 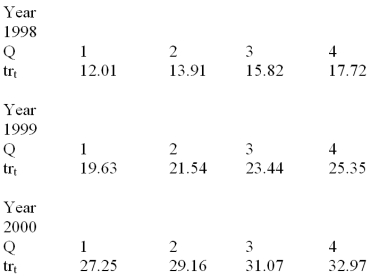 Isolate the cyclical and irregular components by calculating the estimate of CLt* IRt for the first four quarters in the time series.
(Essay)
4.8/5 (32)
A forecasting method that weights recent observations more heavily is called ____.
(Multiple Choice)
4.8/5 (36)
Use the following information for the three grains. 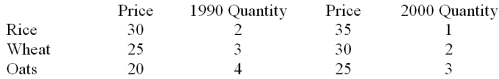 Calculate the Paasche index.
(Essay)
4.8/5 (35)
Listed below are the price of a pair of men's boots over a 50 year time period. 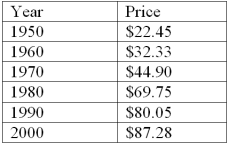 Find the simple index numbers for the data with 1950 as the base year.
(Essay)
4.7/5 (42)
Filters
- Essay(0)
- Multiple Choice(0)
- Short Answer(0)
- True False(0)
- Matching(0)