Exam 14: Multiple Regression
Exam 1: An Introduction to Business Statistics54 Questions
Exam 2: Descriptive Statistics: Tabular and Graphical Methods90 Questions
Exam 3: Descriptive Statistics: Numerical Methods149 Questions
Exam 4: Probability135 Questions
Exam 5: Discrete Random Variables128 Questions
Exam 6: Continuous Random Variables150 Questions
Exam 7: Sampling and Sampling Distributions116 Questions
Exam 8: Confidence Intervals144 Questions
Exam 9: Hypothesis Testing148 Questions
Exam 10: Statistical Inferences Based on Two Samples132 Questions
Exam 11: Experimental Design and Analysis of Variance115 Questions
Exam 12: Chi-Square Tests96 Questions
Exam 13: Simple Linear Regression Analysis148 Questions
Exam 14: Multiple Regression122 Questions
Exam 15: Model Building and Model Diagnostics102 Questions
Exam 16: Time Series Forecasting150 Questions
Exam 17: Process Improvement Using Control Charts122 Questions
Exam 18: Nonparametric Methods97 Questions
Exam 19: Decision Theory90 Questions
Select questions type
Below is a partial multiple regression computer output. 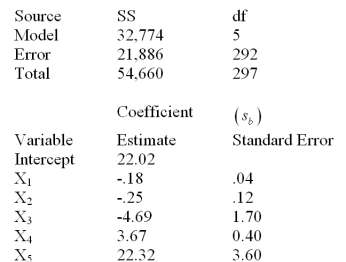 Write the least squares prediction equation.
Free
(Essay)
4.7/5  (30)
(30)
Correct Answer: Verified
 = 22.02-.18x1-.25x2- 4.69x3 + 3.67x4 + 22.32x5
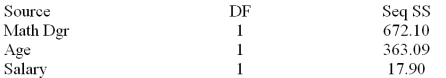
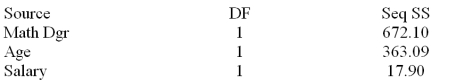
Consider the following partial computer output for a multiple regression model. 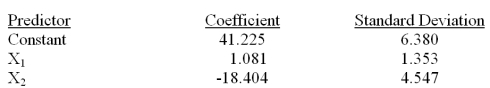 Analysis of Variance
 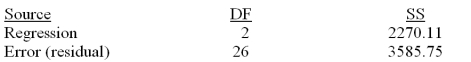 Write the least squares prediction equation.
Free
(Essay)
4.8/5 (36)
Correct Answer:Verified
ŷ = 41.225 + 1.081x1 - 18.404x2
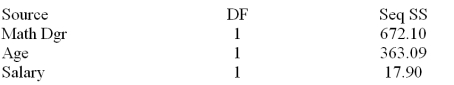
A member of the state legislature has expressed concern about the differences in the mathematics test scores of high school freshmen across the state.She asks her research assistant to conduct a study to investigate what factors could account for the differences.The research assistant looked at a random sample of school districts across the state and used the factors of percentage of mathematics teachers in each district with a degree in mathematics,the average age of mathematics teachers and the average salary of mathematics teachers 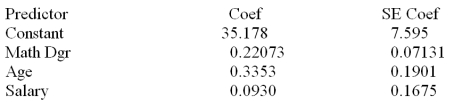 s = 7.62090
Analysis of Variance
s = 7.62090
Analysis of Variance 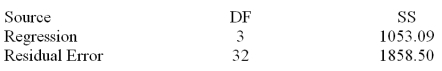
 Calculate R2.
Free
(Essay)
4.9/5 (28)
Correct Answer:Verified
0.3617
R2 = 1053.09/2911.59 = 0.3617
Consider the following partial computer output for a multiple regression model. 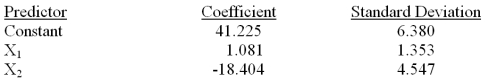 Analysis of Variance
  Determine the 95% interval for 2 and interpret its meaning
(Essay)
4.9/5 (33)
Consider the following partial computer output for a multiple regression model. 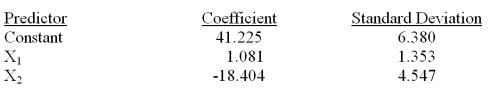 Analysis of Variance
 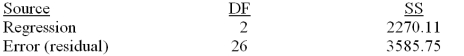 Calculate R2.
(Essay)
4.9/5 (34)
In a multiple regression model,the explained sum of squares divided by the total sum of squares yields the ___________.
(Multiple Choice)
4.9/5 (33)
A member of the state legislature has expressed concern about the differences in the mathematics test scores of high school freshmen across the state.She asks her research assistant to conduct a study to investigate what factors could account for the differences.The research assistant looked at a random sample of school districts across the state and used the factors of percentage of mathematics teachers in each district with a degree in mathematics,the average age of mathematics teachers and the average salary of mathematics teachers 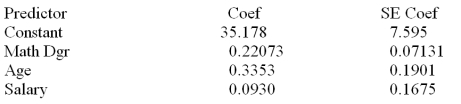 s = 7.62090
Analysis of Variance
s = 7.62090
Analysis of Variance 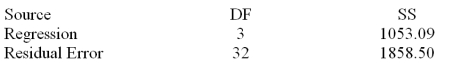
 Additional information related to this point estimate of 65.12 is given below.
Predicted Values for New Observations
50% with math degree,average age of 43 and average salary is 48.3
New
Additional information related to this point estimate of 65.12 is given below.
Predicted Values for New Observations
50% with math degree,average age of 43 and average salary is 48.3
New 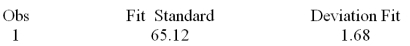 Determine the 95% confidence interval for this estimate and interpret its meaning.
(Essay)
4.9/5 (36)
Regression models that employ more than one independent variable are referred to as multiple regression models.
(True/False)
4.7/5 (38)
Consider the following partial computer output for a multiple regression model. 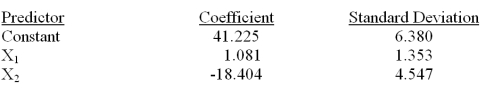 Analysis of Variance
 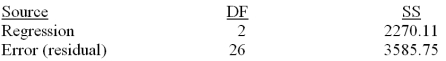 Calculate the adjusted R2.
(Essay)
4.7/5 (42)
The management of a professional baseball team is in the process of determining the budget for next year.A major component of future revenue is attendance at the home games.In order to predict attendance at home games the team statistician has used a multiple regression model with dummy variables.The model is of the form: y = 0 + 1x1 + 2x2 + 3x3 + where:
Y = attendance at a home game
x1 = current power rating of the team on a scale from 0 to 100 before the game.
x2 and x3 are dummy variables,and they are defined below.
x2 = 1,if weekend
x2= 0,otherwise
x3= 1,if weather is favorable
x3= 0,otherwise
After collecting the data based on 30 games from last year,and implementing the above stated multiple regression model,the team statistician obtained the following least squares multiple regression equation:  The multiple regression compute output also indicated the following:
 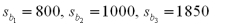 Interpret the estimated model coefficient b3.
(Essay)
4.8/5 (39)
Consider the following partial computer output for a multiple regression model. 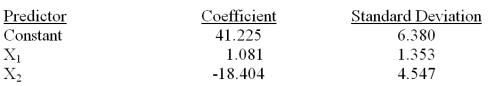 Analysis of Variance
 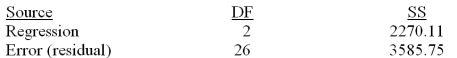 Test the usefulness of variable x2 in the model at
  = .05.Calculate the t statistic and state your conclusions.
(Essay)
4.9/5 (36)
The _____ term describes the effects on y of all factors other than the independent variables in a multiple regression model.
(Multiple Choice)
4.8/5 (41)
Consider the following partial computer output for a multiple regression model. 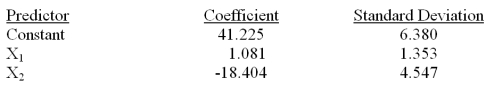 Analysis of Variance
 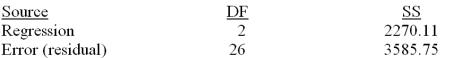 What is the explained variation?
(Essay)
4.9/5 (45)
The management of a professional baseball team is in the process of determining the budget for next year.A major component of future revenue is attendance at the home games.In order to predict attendance at home games the team statistician has used a multiple regression model with dummy variables.The model is of the form: y = 0 + 1x1 + 2x2 + 3x3 + where:
Y = attendance at a home game
x1 = current power rating of the team on a scale from 0 to 100 before the game.
x2 and x3 are dummy variables,and they are defined below.
x2 = 1,if weekend
x2= 0,otherwise
x3= 1,if weather is favorable
x3= 0,otherwise
After collecting the data based on 30 games from last year,and implementing the above stated multiple regression model,the team statistician obtained the following least squares multiple regression equation:  The multiple regression compute output also indicated the following:
  Assume that the overall model is useful in predicting the game attendance and the team statistician wants to know if the mean attendance is higher on the weekends as compared to the weekdays.At = .05,test to determine if the attendance is higher on weekend home games.
(Essay)
4.8/5 (35)
Below is a partial multiple regression ANOVA table. 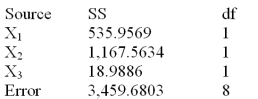 What is the total sum of squares and the degrees of freedom for total sum of squares?
(Essay)
4.8/5 (29)
A member of the state legislature has expressed concern about the differences in the mathematics test scores of high school freshmen across the state.She asks her research assistant to conduct a study to investigate what factors could account for the differences.The research assistant looked at a random sample of school districts across the state and used the factors of percentage of mathematics teachers in each district with a degree in mathematics,the average age of mathematics teachers and the average salary of mathematics teachers 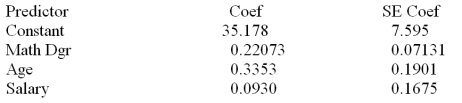 s = 7.62090
Analysis of Variance
s = 7.62090
Analysis of Variance 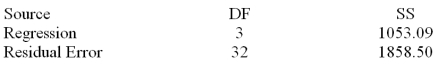
 What is the mean square error?
(Essay)
4.8/5 (36)
Consider the following partial computer output for a multiple regression model. 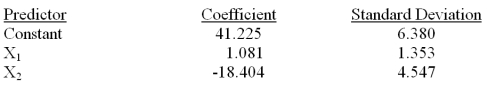 Analysis of Variance
 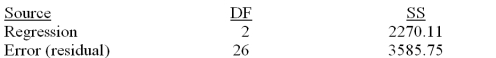 What is the number of observations in the sample?
(Essay)
4.8/5 (38)
A t-test is used in testing the significance of an individual independent variable.
(True/False)
5.0/5 (38)
The management of a professional baseball team is in the process of determining the budget for next year.A major component of future revenue is attendance at the home games.In order to predict attendance at home games the team statistician has used a multiple regression model with dummy variables.The model is of the form: y = 0 + 1x1 + 2x2 + 3x3 + where:
Y = attendance at a home game
x1 = current power rating of the team on a scale from 0 to 100 before the game.
x2 and x3 are dummy variables,and they are defined below.
x2 = 1,if weekend
x2= 0,otherwise
x3= 1,if weather is favorable
x3= 0,otherwise
After collecting the data based on 30 games from last year,and implementing the above stated multiple regression model,the team statistician obtained the following least squares multiple regression equation:  The multiple regression compute output also indicated the following:
  Assume today is Saturday morning and the weather forecast indicates sunny,excellent weather conditions for the rest of the day and that the overall model is useful in predicting the game attendance.Later today,there is a home baseball game for this team.If the current power rating of the team is 92,use the model given above and predict the attendance for today's game.
(Essay)
4.9/5 (43)
The effects of different levels of qualitative independent variables are described using _____ variables.
(Multiple Choice)
4.8/5 (37)
Filters
- Essay(0)
- Multiple Choice(0)
- Short Answer(0)
- True False(0)
- Matching(0)